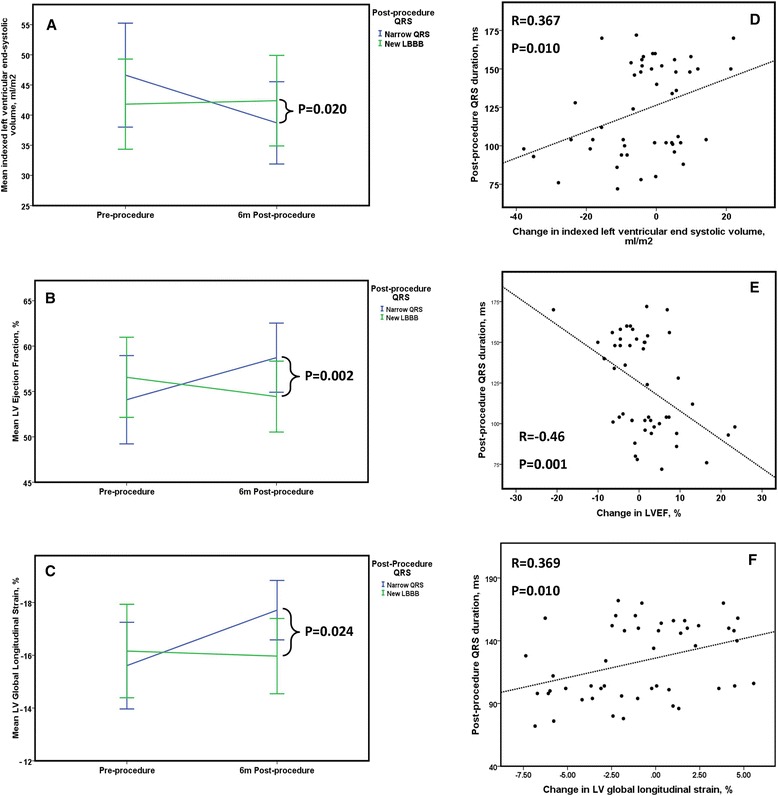
Fig. 2.

Line graphs depicting change in LVESVi (Panel a), LVEF (Panel b) and global longitudinal strain (Panel c) before and 6 m following TAVR according to post-procedure QRS duration, the vertical lines represent the 95% confidence intervals. Panels d, e and f demonstrate the relationship between post-procedure QRS duration and change in LVESVi, LVEF and GLS
