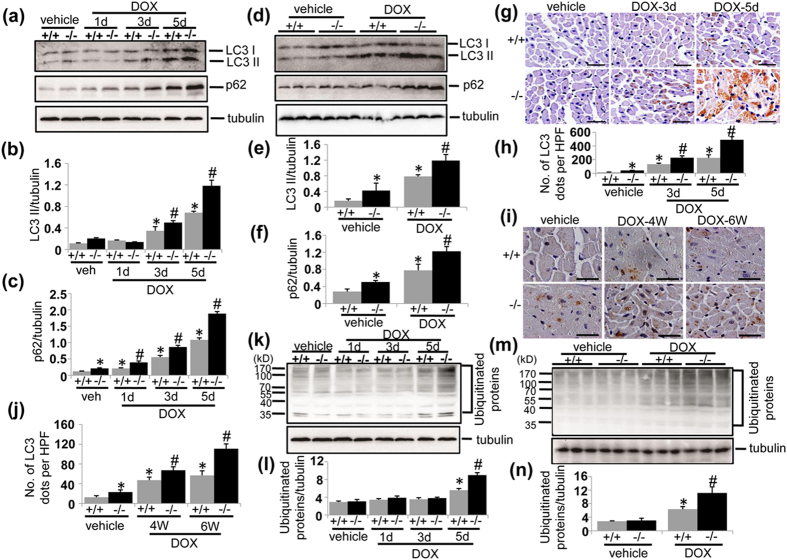
Figure 5. UVRAG deficiency aggravates impaired autophagy in DOX-induced cardiotoxicity.
(a) Western blot detection of LC3 II and p62 protein levels in LVs from WT and UVRAG-deficient mice at the time points as indicated in acute DOX-treated mice. (b) Quantification of LC3 II protein abundance in the experiments as illustrated in (a). n = 3–5 mice for each group. (c) Quantification of p62 protein abundance in the experiments as illustrated in (a). n = 3–5 mice for each group. (d) Western blot detection of LC3 II and p62 protein levels in LVs from WT and UVRAG-deficient mice at 4 weeks of DOX or vehicle treatment in chronic DOX-treated mice. (e) Quantification of LC3 II protein abundance in the experiments as illustrated in (d). n = 3 mice for each group. (f) Quantification of p62 protein abundance in the experiments as illustrated in (d). n = 3 mice for each group. (g) Representative images of LC3 immunohistochemistry in LVs on heart sections from WT and UVRAG-deficient mice after acute DOX or vehicle treatment over the indicated time. Scale bar: 40 μm. (h) Quantification of LC3-positive dots in LVs in the experiments as illustrated in (g). n = 3 mice for each group. (i) Representative images of LC3 immunohistochemistry in LVs on heart sections from WT and UVRAG-deficient mice after chronic DOX or vehicle treatment over the indicated time. Scale bar: 40 μm. (j) Quantification of LC3-positive dots in LVs in the experiments as illustrated in (i). n = 3 mice for each group. (k) Western blot detection of ubiquitinated proteins in LVs from WT and UVRAG-deficient mice at the time points as indicated in acute DOX-treated mice. (l) Quantification of protein ubiquitination in the experiments as illustrated in (k). n = 3 mice for each group. (m) Western blot detection of ubiquitinated proteins in LVs from WT and UVRAG-deficient mice at the time points as indicated in chronic DOX-treated mice. (n) Quantification of protein ubiquitination in the experiments as illustrated in (m). n = 3 mice for each group. *P < 0.05 vs. WT + vehicle. #P < 0.05 vs. WT + DOX.

