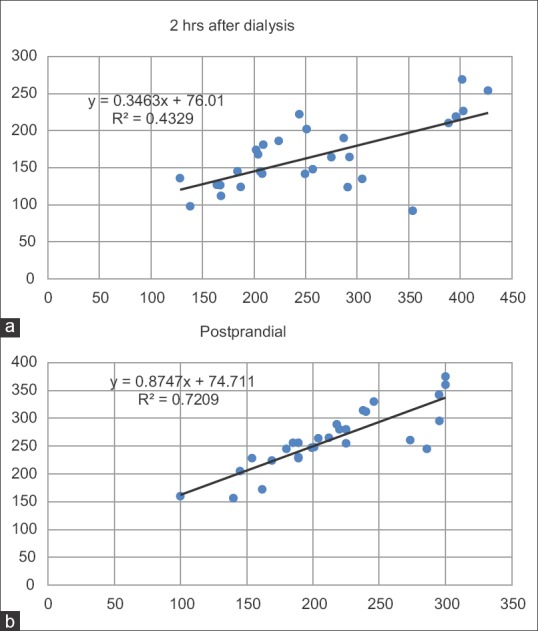
Figure 4.

Scattered plot graph showing correlation of predialysis sugar levels to 2 h postdialysis (a) and fasting blood sugar levels to postprandial levels (b). Both sets of data showed “strong” positive correlation with r = 0.657 and 0.849. In both graphs, the linear equation of the trend line and R2 value is displayed
