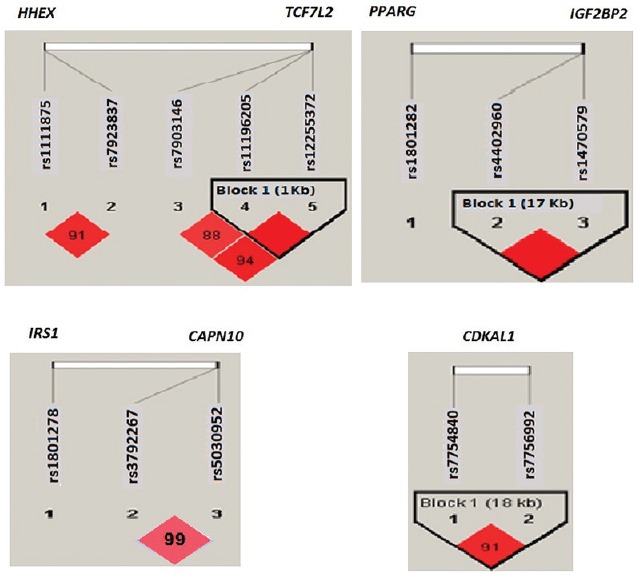
Fig. 1.

Linkage disequilibrium (LD) plots of single-nucleotide polymorphisms (SNPs) of genes in the same chromosome, i.e. TCF7L2, HHEX; IGF2BP2, PPARG; IRS1, CAPN10; CDKAL1. *D’ values mentioned in the linkage disequilibrium plot, except in two cases where the linkage disequilibrium was complete (100%). The pairs of SNPs with D’ value ≥ 80 per cent are considered to be in significant LD. Linkage disequilibrium is seen only between SNPs of the same gene, not across the genes, even on the same chromosome. The r2 values for the above linkage disequilibrium plot ranged from 0.44 to 0.98, but in case of CAPN10, it was very low (r2 = 0).
