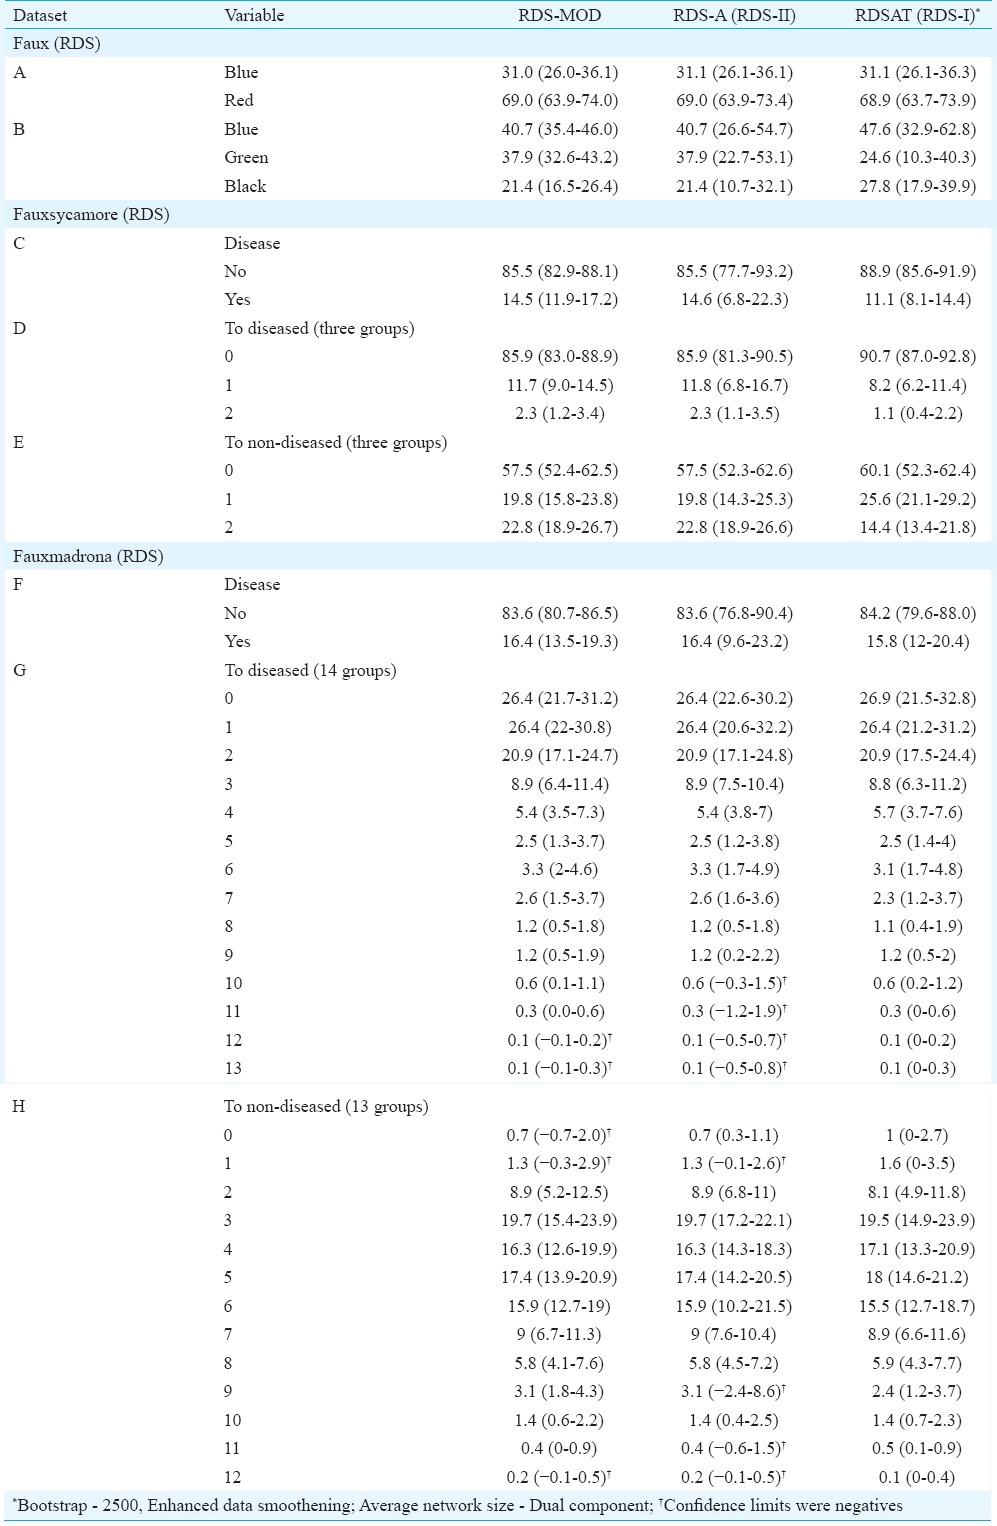
Table III.
Estimates of proportions [given as (estimates and 95% CI)] of various subgroup of variables using respondent-driven sampling (RDS)-MOD (modified), RDS-A (analyst) and respondent-driven sampling analysis tool (RDSAT) on different datasets, viz. faux, fauxsycamore, fauxmadrona

