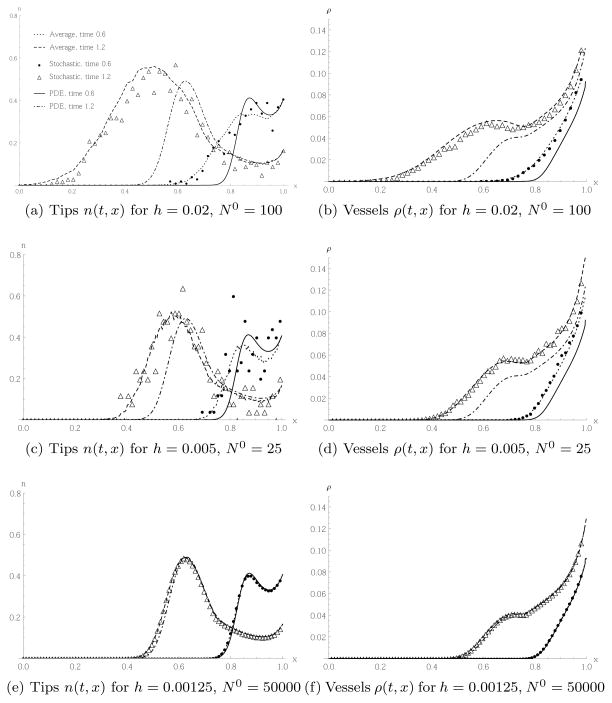
Fig. 12.
Results of the PDE (45) and the stochastic model defined by (44). The averaging of the stochastic model is over 100 realisations. The plots show spatial tip and vessel distributions for different lattice constants and initial numbers of tip cells, at two different times. In (c)–(f) we have omitted some points in the plot for the stochastic model for better visualisation. We used the units of [8] for better comparison.

