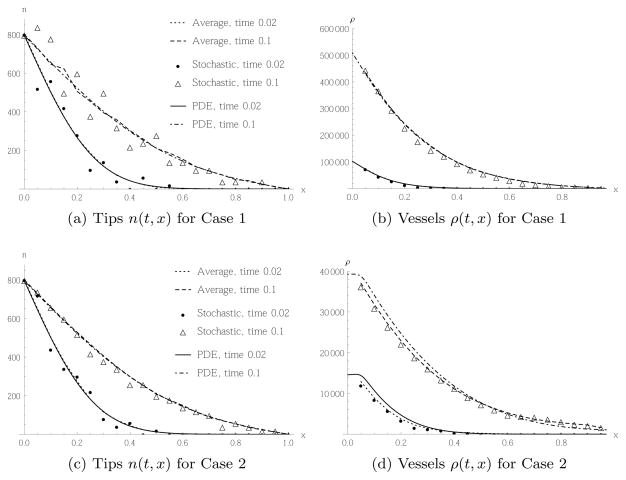
Fig. 6.
Comparison of tip migration and subsequent vessel production of a single realisation of the stochastic model (5) or (6) in Case 1 and 2, respectively, the average of 64 realisations, and the PDE (23) or (27). Initial and boundary conditions as in (41) and (40) for initially N0 = 40 tip cells in the leftmost box. In each case the spatial distribution of tips or vessels respectively is shown at two times.

