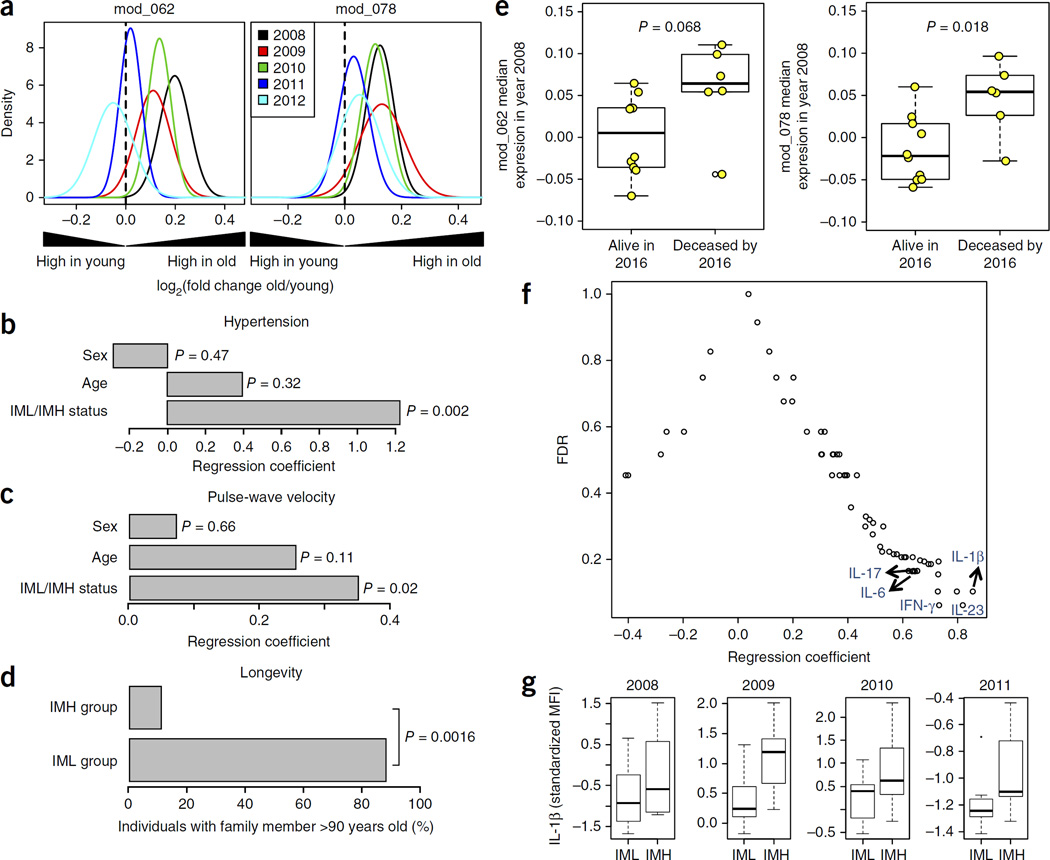
Figure 1.
Expression of inflammasome gene modules in older adults and its association with human health and longevity. (a) Gene expression data from the Stanford–Ellison longitudinal cohort4,12,13 (n = 114) were used to find age-associated gene modules that participate in cytokine production and were enriched for inflammasome genes (see Supplementary Figs. 1 and 2). For the determination of significant differences in the expression of inflammasome gene modules 62 and 78, the QuSAGE gene set analysis method19 was used. Positive fold change values (x-axis) indicate higher expression in aged individuals in samples taken from 2008–2012. P-value for age on combined data for each gene module, 0.001. (b) A logistic regression analysis was conducted on IML (n = 11) or IMH (n = 12) group status and hypertension (shown are regression coefficients for age, sex and IML/IMH status). (c) Seventeen individuals from the year 2011 cohort (the same 8 IML and 9 IMH individuals as in b) were studied to measure the association of IML versus IMH status with the degree of arterial stiffness, as measured by pulse-wave velocity. Multiple regression analysis was performed on the pulse-wave velocity of each individual against their age, sex and IML/IMH status (shown are regression coefficients for each variable). P-values in b,c for each regression coefficient were calculated based on permutation methods (see Online Methods). (d) In the same 17 individuals from the year 2011 cohort, familial longevity was determined on the basis of membership in a family with at least one member over 90 years of age. The P-value was obtained by chi-square test. (e) Association between the expression of inflammasome gene modules 62 and 78 with all-cause mortality. Each point is representative of one individual. The P-value was obtained by Student’s t-test. (f) Serum levels of 62 different cytokines, chemokines and growth factors were compared between IML and IMH subjects using data from year 2013 (IML n = 8, IMH n = 8). Multiple regression analysis on each analyte’s MFI against their age, sex and IML/IMH status was conducted and significance (y-axis) was obtained via permutation tests. (g) IL-1β serum abundance, as shown by longitudinal analysis of data collected during the years 2008–2011 (IML n for 2008, 2009, 2010 and 2011 = 10, 10, 8 and 7, respectively; IMH n 2008, 2009, 2010 and 2011 = 12, 11, 12 and 8, respectively). Whisker bars represent maximum and minimum values.

