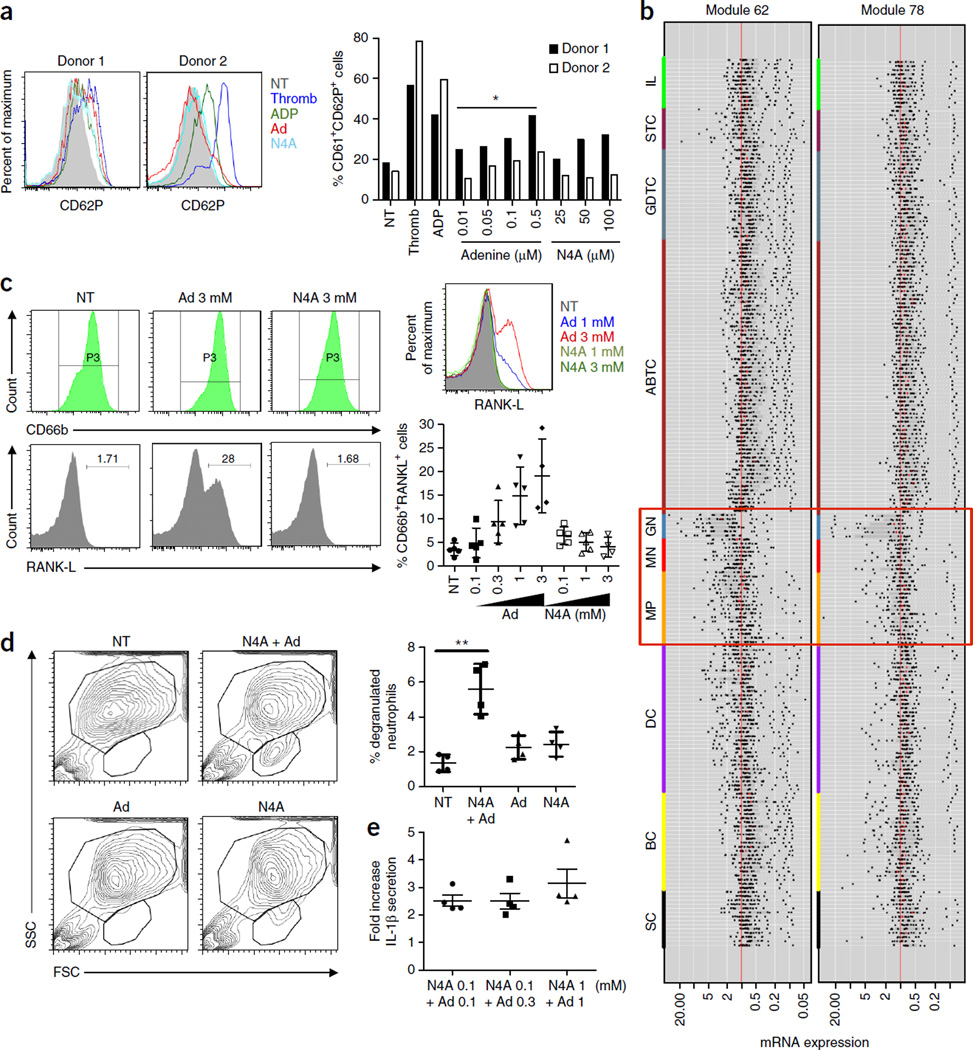
Figure 4.
Metabolites in IMH individuals activate human primary platelets and neutrophils. (a) Primary platelets were isolated from blood of healthy donors and were incubated for 6 h with thrombin, ADP (3 µM) or various concentrations of adenine or N4A. Platelet activation was monitored by measuring the membrane expression of CD61 and CD62P in healthy cells by flow cytometry. Histograms show overlay of CD62P staining within the CD61 positive population for Adenine (0.5 µM) and N4A (100 µM) for each donor. Bar graph summarizes the results obtained from each donor. Student’s t-test with *P < 0.05 applies to each donor. (b) Analysis of immune cell type populations (ImmGen database) show that modules 62 and 78 are predominantly expressed in macrophages, monocytes and granulocytes (orange, red and blue respectively) (P < 10−10). SC, stem cells; BC, B cells; DC, dendritic cells; MP, macrophages; MN, monocytes; GN, granulocytes; ABTC, αβ T cells; GDTC, γδ T cells; STC, stromal cells; IL, innate lymphocytes. (c) Primary neutrophils were isolated from blood of healthy donors and then incubated for 24 h with various concentrations of adenine or N4A either separately or in combination. the concentration of RANK-L+ cells present within the CD66b+ population was determined. Histograms show overlay of RANK-L staining within the CD66b+ population. Graph below summarizes the results of each donor. (d) Primary neutrophils were treated with N4A (1 mM) and/or adenine (1 mM), and the percentage of degranulated population was measured as shown in the scatter plot. Graph at right summarizes results obtained from each donor. (e) Primary neutrophils were treated as described previously with the compounds as indicated in the figure, and IL-1β secretion was measured from the cell culture supernatants obtained from each donor. Data are expressed either as the concentration of cytokines (pg/mL) or as the fold increase with respect to the non-treated (NT) condition as indicated. P-values in a,d,e were determined by Student’s t-test. *P < 0.05, **P < 0.01.

