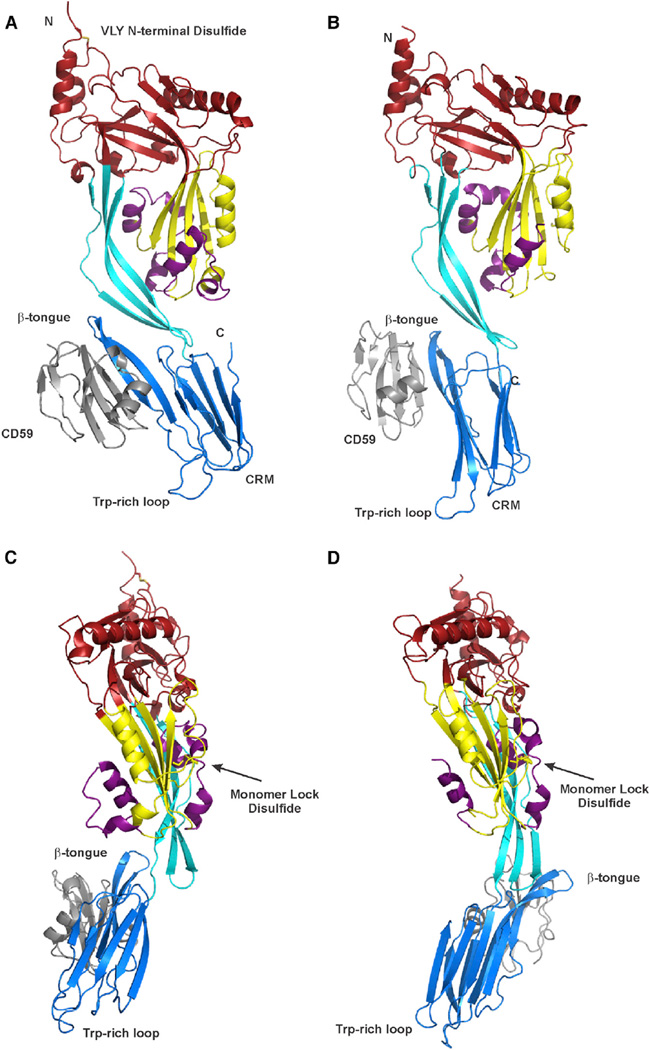
Figure 1. Crystal Structures of the CDC-CD59 Complexes.
The structures are shown in ribbon representation. D1 is colored red, D2 cyan, D3 yellow, and D4 dark blue. The TMH1 and TMH2 regions are colored mauve. Two of the membrane-sensing loops of D4 (Trp-rich UDP loop and L1 loop housing the cholesterol-recognition motif) and the D4 β tongue are indicated. CD59D22A is gray.
(A) VLYml-CD59D22A.
(B) ILYml-CD59D22A.
(C) VLYml-CD59D22A.
(D) ILYml-CD59D22A.
See also Figures S1 and S3.

