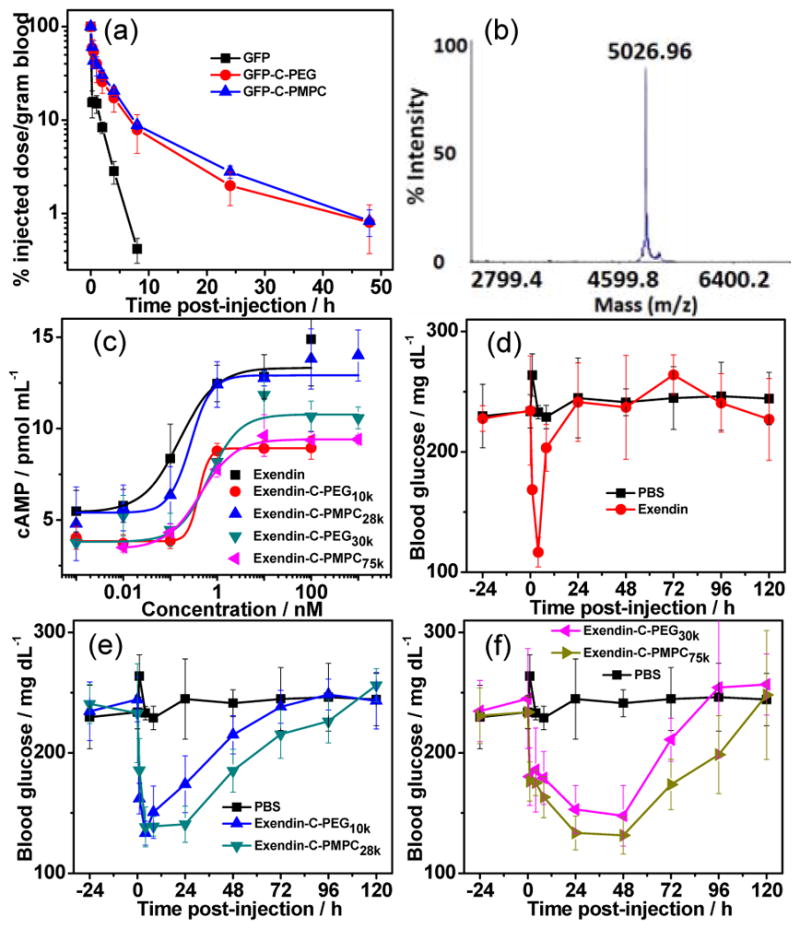
Figure 3.

(a) Blood concentration as a function of time post–injection. (b) MALDI–TOF of exendin–C–N3. (c) Cyclic adenosine monophosphate (cAMP) response of exendin–4 conjugates in baby hamster kidney (BHK) cells expressing the GLP–1R. Fed blood glucose levels in 6–week–old male C57Bl/6J mice (n=5) maintained on a 60 kCal% diet before and after a single s.c. injection of (d) unmodified exendin–4, (e) exendin–C–PEG10k and exendin–C–PMPC28k, (f) exendin–C–PEG30k and exendin–C–PMPC75k. Exendin–4 and conjugates were administered at a dose of 25 nmol/kg and PBS was injected as control at equivalent volume at t=0 h. Glucose levels of blood sampled from the tail of mouse were measured at given time points.
