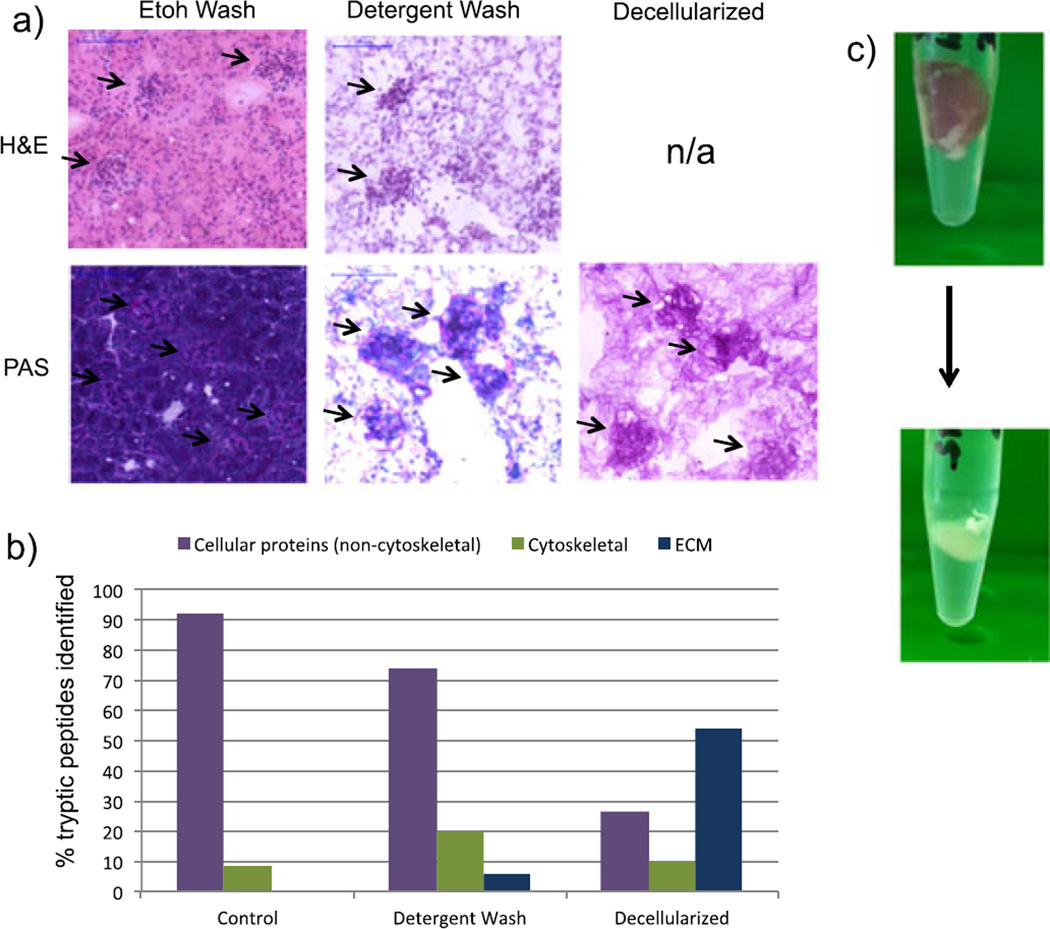
Figure 1.
(a) Stained sections of ethanol-washed mouse renal tissue, detergent-washed tissue, and decellularized tissue. Top: H&E stain, staining nuclei purple and cytoplasm pink. Bottom: PAS, staining nuclei dark purple and glycans/glycoproteins dark pink. (b) Percent of tryptic peptides identified in LC–MS/MS analysis of mouse kidney tissue extracts from ethanol-washed (‘control’), detergent-washed, and decellularized tissue. The graph shows peptides classified by non-cytoskeletal, cellular proteins, cytoskeletal proteins, and ECM proteins. (c) Mouse kidney before (top) and after (bottom) 4 days of incubation in 2% SDS.

