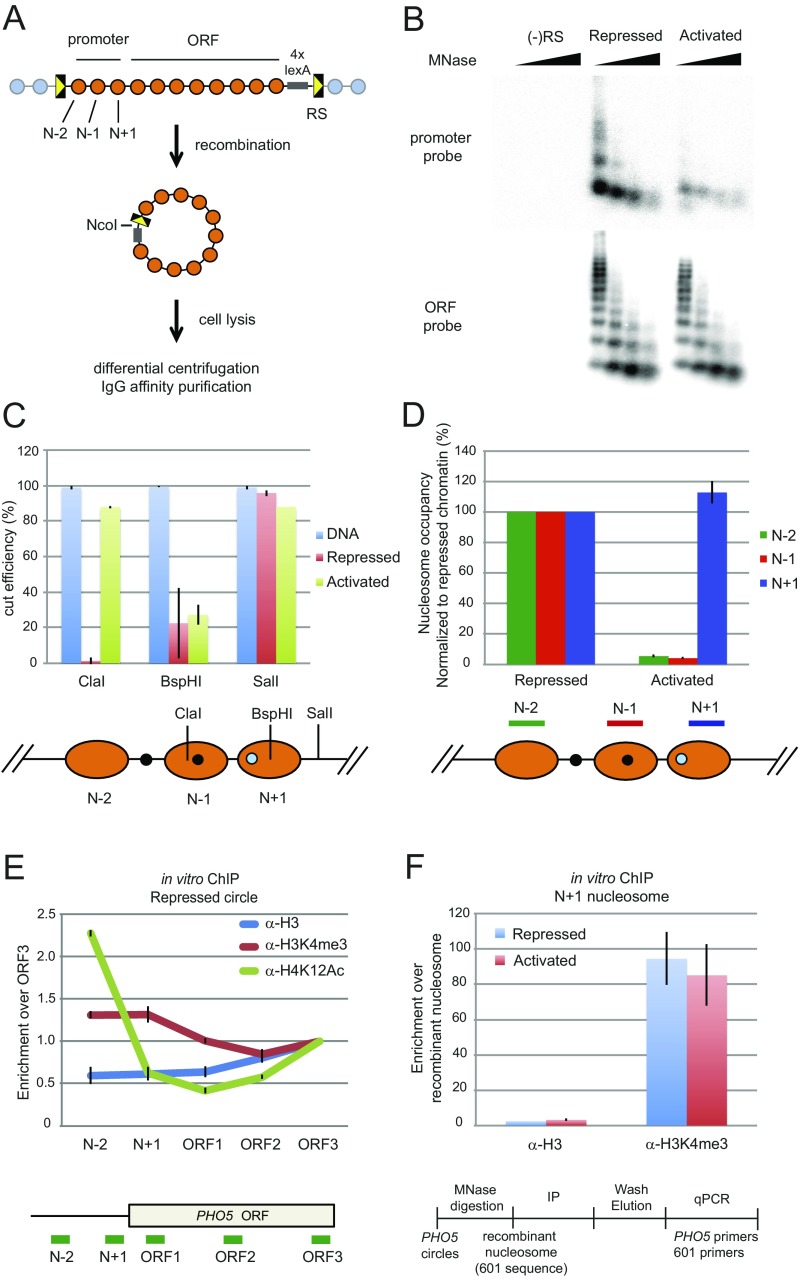
Fig. S1.
Purification of PHO5 chromatin circles. (A) The genomic PHO5 gene is flanked by two recognition sites (RSs) for R recombinase. Excision of the PHO5 locus occurs after expression of the recombinase is induced with galactose. The resulting chromatin circles were purified by differential centrifugation and affinity purification with the use of an LexA binding site within the chromatin circle and a TAP-tagged LexA adaptor protein constitutively expressed from a chromosomal locus (10, 11). (B) Micrococcal nuclease (MNase) digestion of purified gene circles. Chromatin circles purified from pho4Δ (repressed), pho80Δ (activated), and (−)RS (mock strain) cells were digested with 4, 12, 36, and 108 units MNase (NEB). DNA was extracted, subjected to 1.5% agarose gel electrophoresis, and analyzed by blot hybridization with a probe spanning PHO5 nucleosomes N + 2 to N + 4 (ORF probe) or nucleosomes N − 2 to N + 1 (promoter probe). Hybridization signal from the activated promoter is about one-third of that from the repressed promoter, showing that an average of one promoter nucleosome remains in the transcriptionally activated state (12). (C) Restriction endonuclease accessibility of the purified PHO5 circles. Restriction enzymes were used to examine the positioning and occupancy of the promoter nucleosomes. Chromatin circles (repressed or activated; 1 fmol) or equivalent amounts of naked DNA were digested with 0 (no digest control) or 20 units restriction endonuclease indicated for 1 h at 30 °C. The DNA was extracted, and the amount of DNA before or after digestion was determined by qPCR using PCR primer sets flanking each restriction site. The cut efficiency was subsequently calculated. (D) MNase digestion of repressed or activated PHO5 circles. Chromatin circles (1 fmol) purified from WT (repressed) and pho80Δ (activated) cells were digested with 0 (no digest control) or 72 (generating mononucleosomes; B) units MNase (NEB). DNA was extracted, and the amount of each nucleosomal DNA before or after digestion was determined by qPCR using the PCR primer pairs shown below. To calculate the occupancy of each nucleosome, the amount of DNA after digestion was first divided by the amount of DNA before digestion. These values in the repressed chromatin were set as 1 [N + 1, N − 1, and N − 2 nucleosomes are always present in the repressed promoter (24, 45)], and the occupancy of each nucleosome in the activated promoter circles was subsequently calculated. (E) Repressed PHO5 gene circles showed characteristic distribution of H3K4me3 and acetylated H4K12 (H4K12Ac) as shown in vivo (23, 26). PHO5 chromatin circles were digested to mononucleosomes by MNase, and IP was performed with α-H3, α-H3K4me3, or α-H4K12Ac antibodies. Fold increase reflects the ratio of signals at different PHO5 locations divided by that of PHO5 ORF3 after normalization to the ratio obtained in the input fraction. The mean of three experiments is shown with SEM. (F) H3K4me3 is associated with the promoter of both repressed and activated PHO5 gene circles as in vivo (26). PHO5 chromatin circles were digested to mononucleosomes by MNase followed by the addition of recombinant nucleosomes (with no modifications) assembled on the 601 positioning sequence serving as a normalization reference. Independent IP reactions were performed with α-H3 and α-H3K4me3 antibodies. Enrichment of H3 or H3K4me3 was calculated as the ratio of qPCR signals at the PHO5 promoter (N + 1) divided by that of the 601 sequence after normalization to the ratio obtained in the input fraction. A mean of several experiments is shown with SEM.

