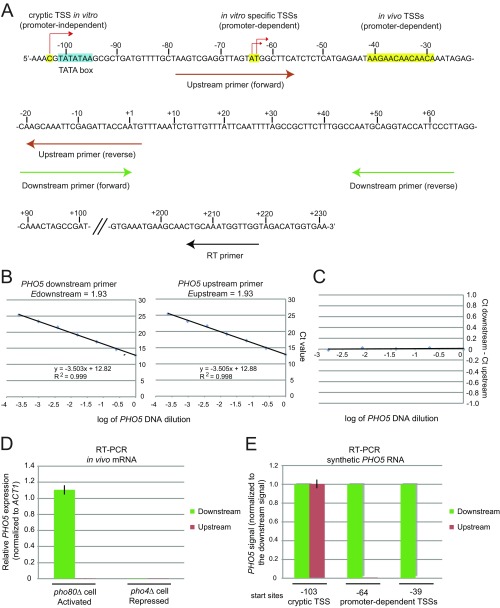
Fig. S2.
Validation of RT-PCR method. (A) 5′ RACE of in vitro PHO5 transcripts revealed three major initiation regions (Fig. 2): in vivo TSSs (positions from −41 to −29), TATA-dependent in vitro-specific TSSs [positions −63 and −64 corresponding to TSSs in metazoans (46)], and a TATA-independent cryptic TSS (position −103). Two sets of PHO5 primers were used to detect TATA-dependent specific transcripts. The downstream primer pair detects all transcripts, whereas the upstream primer pair only detects cryptic transcripts (E). Because the upstream and downstream primer pairs amplified their target sequences at the same rate (B and C), promoter-dependent transcription signal was calculated by subtracting the upstream signal from the downstream signal. (B) Amplification efficiency (E) of each prime pair was determined by replicate analyses of dilution series prepared from linear reference PHO5 DNA of known amount containing the entire promoter and ORF sequence (Edownstream = 1.93; Eupstream = 1.93; ElacI = 1.93). (C) When the difference in Ct value (ΔCt) between the upstream and downstream primer pair was recorded with dilution series of reference PHO5 DNA of known amount, ΔCt values were nearly zero at all template concentrations tested. This control suggested that the PHO5 upstream and downstream primer pairs amplified their target sequences exactly at the same rate, enabling us to directly calculate and compare ΔCt values between the upstream and downstream primer pairs. (D) Validation of the specificity of each primer pair. RT-PCR was performed with in vivo mRNA extracted from the indicated strains. PHO5 expression is constitutively activated in the pho80Δ strain, whereas PHO5 expression is completely repressed in the pho4Δ strain. The downstream primer pair detected in vivo PHO5 transcripts extracted from the pho80Δ strain, whereas the upstream primer pair did not. No signal was detected from the RNA extracted from the pho4Δ strain, attesting to the specificity of the primer pairs. (E) As an additional test of specificity of each primer pair, RT-PCR was performed with synthetic PHO5 RNA transcribed in vitro with T7 RNA polymerase. Synthetic PHO5 RNA molecules were transcribed from three different sites: a cryptic TSS (position −103), an in vitro-specific TSS (TATA-dependent; position −64), and an in vivo TSS (position −38). Each synthetic PHO5 RNA molecule was reverse-transcribed with the PHO5 gene-specific RT primer (RT2) (Table S2), and cDNA was analyzed by qPCR using the PHO5 upstream and downstream primer pairs. For each PHO5 RNA, the signal detected by the downstream primer pair was set as one, and the signal detected by the upstream primer pair was calculated using the equation: 1.93ΔCTPHO5, where ΔCtPHO5 = Ctdownstream − Ctupstream. The downstream primer pair detects all RNA molecules, whereas the upstream primer pair only detects the RNA molecule transcribed from a cryptic TSS. In addition, the downstream and upstream primer pairs detect the same amount of transcription arising from the cryptic TSS.

