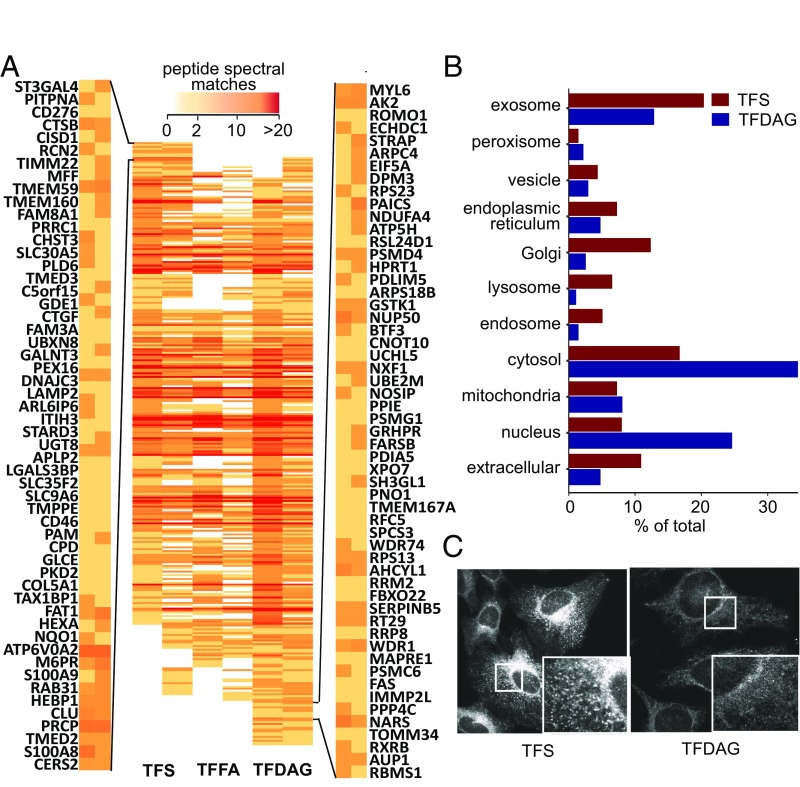
Fig. 3.
Mass spectrometric identification of Sph- and SAG-binding proteins. (A) Heat map of high-confidence proteins identified in both screens. Peptide spectral matches are color-coded according to the legend on the top. Proteins are arranged such that preferential TFS interactors are displayed on the top (the gene symbols for the first 55 proteins are displayed on the left) and TFDAG interactor are grouped near the bottom (55 proteins are displayed on the right). (B) Putative Sph- and DAG-binding were analyzed according to their cellular compartment (CC) GO terms. (C) Confocal microscopy images of HeLa cells labeled with TFS (Left) and TFDAG (Right) under the conditions used in the proteomic experiments. Cells were fixed with methanol, non–cross-linked lipids were washed away, and the remaining cross-linked lipids were clicked to Alexa488-azide.

