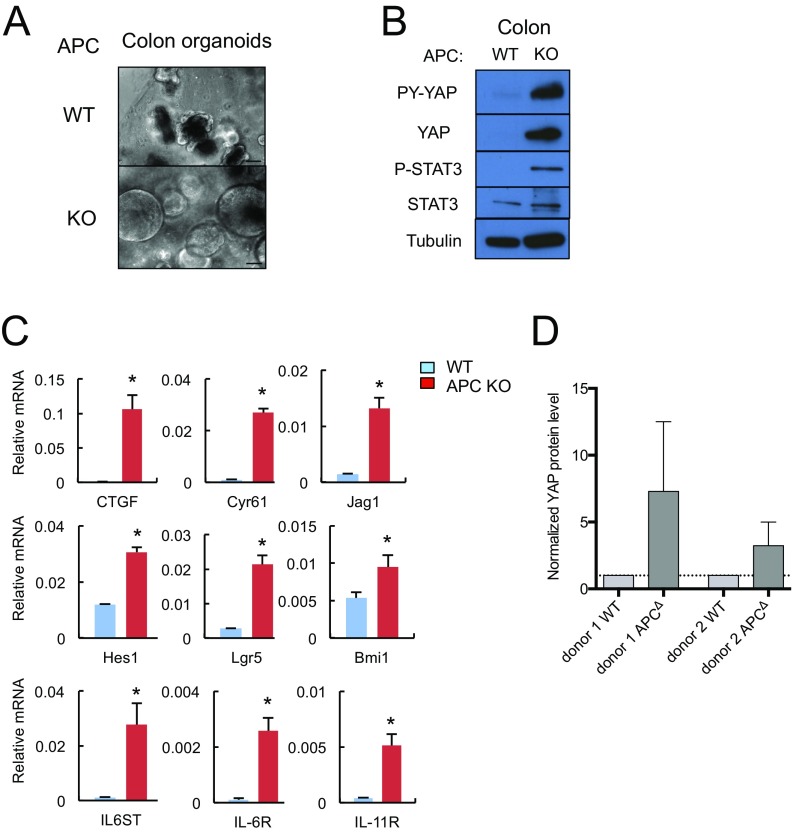
Fig. S4.
(A) Representative images of WT and Apc−/− mouse colon organoids. (Scale bars, 100 μm.) (B) WT and Apc−/− colon organoids were lysed and analyzed for expression and phosphorylation of the indicated proteins. (C) RNA extracted from WT and Apc−/− colon organoids was analyzed by qRT-PCR for expression of the indicated mRNA species. Results are means ± SEM (n = 3). *P < 0.05. (D) Densitometric measurement of YAP protein levels in human colon organoids shown in Fig. 3D was performed using ImageJ and normalized to actin. Results are means of four IB experiments ± SD (n = 4).

