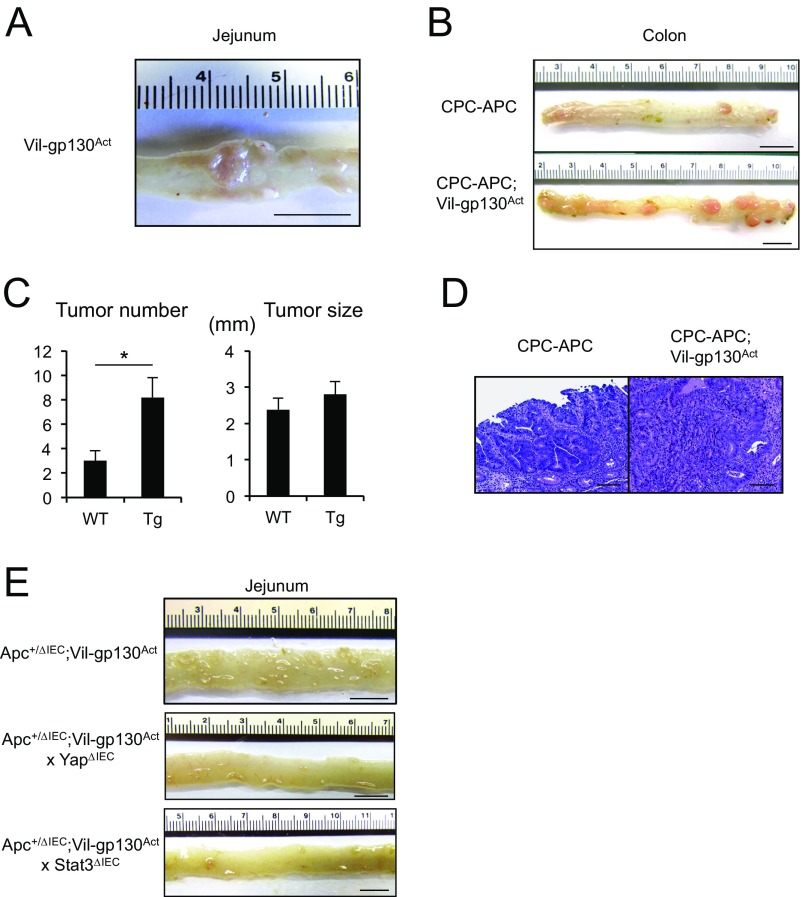
Fig. S6.
(A) A representative image showing small intestinal tumors in 12- to 15-mo-old Vil-gp130Act mice. (B) Representative images of tumor bearing CPC-APC and CPC-APC;Vil-gp130Act colons. (C) Tumor number and size in CPC-APC and CPC-APC;Vil-gp130Act colons. Results are means ± SEM (n = 5 per group). *P < 0.05. (D) H&E-stained paraffin-embedded colon sections from CPC-APC and CPC-APC;Vil-gp130Actmice. (E) Representative images of Apc+/ΔIEC;Vil-gp130Act, Apc+/ΔIEC;Vil-gp130Act;YapΔIECand Apc+/ΔIEC;Vil-gp130Act;Stat3ΔIEC SI. (Scale bars: 10 mm in A, B, and E; 100 μm in D.)

