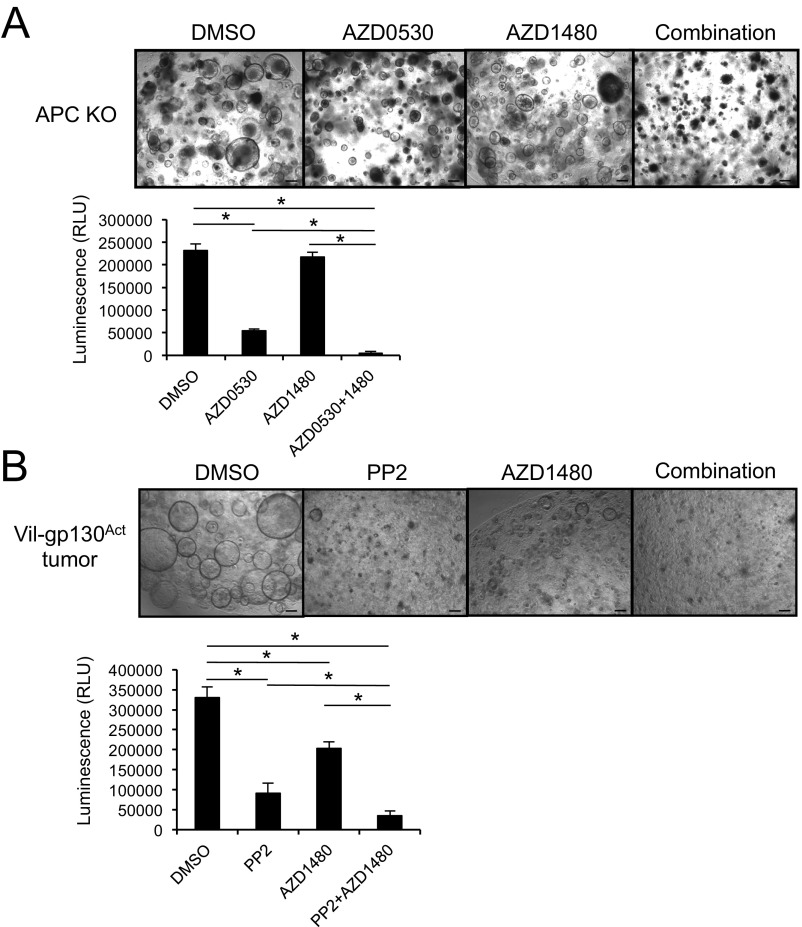
Fig. S7.
(A) Representative images of Apc−/− enteroids treated with the indicated kinase inhibitors (AZD0530, a SFK inhibitor at 10 μM; and AZD1480 at 3 μM) for 3 d. Cell viability was measured using the CellTiter-Glo assay. Results are means ± SEM. *P < 0.05. (B) Representative images of enteroids derived from a Vil-gp130Act-induced small intestinal tumor that was treated with the indicated inhibitors (PP2 at 10 μM, and AZD1480 at 3 μM) for 3 d. Cell viability was measured using the CellTiter-Glo assay. Results are means ± SEM. *P < 0.05. (Scale bars, 100 μm.)

