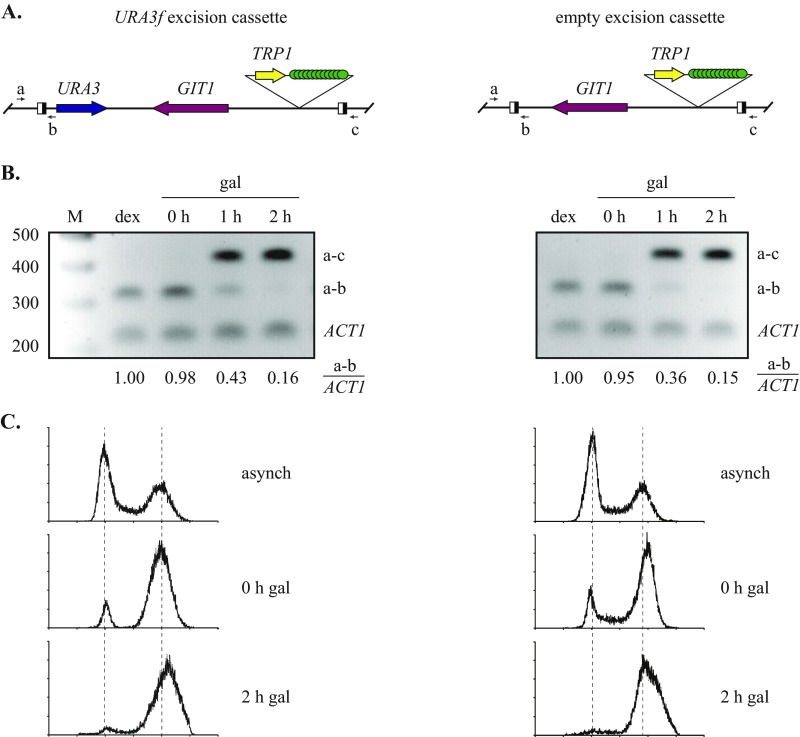
Fig. S2.
Validation of DNA excision and cell cycle arrest. (A) Diagram of the binding sites for the primers used to monitor excision (Table S2). (B) Time course of excision. Strains MSB7 (URA3f) and MSB13 (empty) were first grown asynchronously in dextrose, subcultured in raffinose, and then arrested in M phase by Cdc20 depletion. At 0, 1, and 2 h after the addition of galactose, aliquots of cell culture were harvested. One part was used to make DNA extracts, and the other was fixed with ethanol and stained with SYTOX Green (Molecular Probes). qPCR of the extracts was used to determine the extent of excision (primers a and b) using ACT1 as an internal control. The values reported under each gel lane are the average of two independent trials. The data indicate that excision reached 85% completion in the 2-h time frame of a typical cohesion assay. Ethidium bromide-stained agarose gels show the progression of excision. Each lane contains three pooled PCR reactions (a–c, a–b, and ACT1) after 24 amplification cycles. Lane M, 100 bp ladder. (C) DNA histograms during the cell cycle arrest. Flow cytometry was performed at the Rutgers Environmental and Occupational Health Sciences Institute core facility. The results show that a significant M phase arrest was maintained over the 2-h time frame of a typical cohesion assay.

