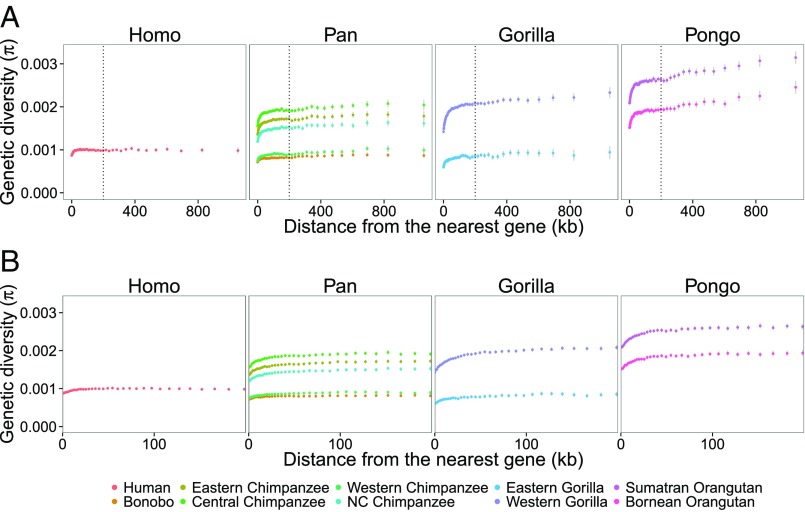
Fig. 1.
Reduction of diversity around genes. Plots show the relationship between the nucleotide diversity, π, and the physical distance to the nearest genes for each genus of the great apes. (A) For distances up to 1 Mb. (B) For distances up to 200 kb. Error bars show 95% confidence intervals calculated from bootstrapping with 1,000 replicates from 1-Mb windows. The name of each (sub) species is shown at Bottom.

