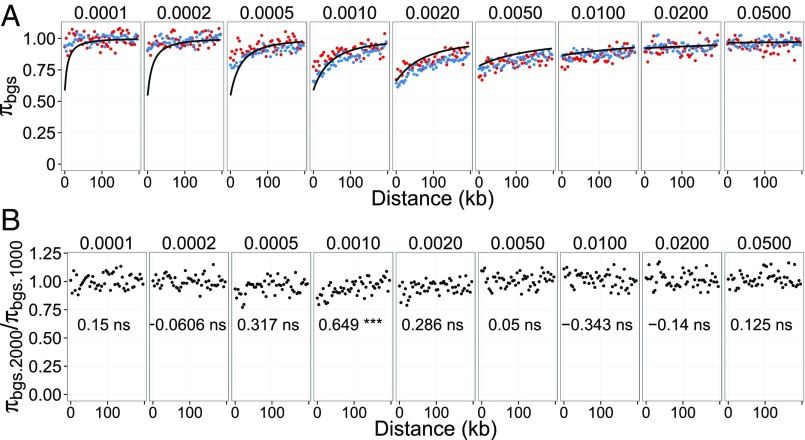
Fig. 4.
Simulations of background selection. The diversity pattern in the sequences flanking the genic region under evolutionary constraint for two populations in which N = 1,000 and 2,000, respectively, is shown. Selection coefficients range from 0.0001 to 0.05. For each set of parameters, we performed 1,000 independent simulations and report the average π. (A) Relationship between the distance from genes and the relative reduction in π due to background selection, πBGS, together with theoretical expectation (based on ref. 23) (black lines). Blue and red points represent when n = 1,000 and n = 2,000, respectively. (B) Relationship between the distance from genes and the ratio of πBGS with n = 2,000 to πBGS with n = 1,000. Pearson’s correlation coefficient and the significance are shown in each panel (***, **, *, and ns indicate Bonferroni-corrected P values with <0.001, <0.01, <0.05, and ≥0.05, respectively).

