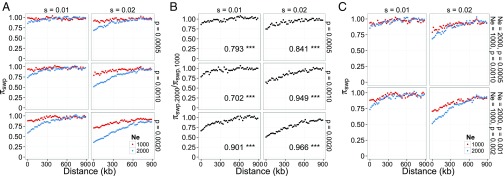
Fig. 5.
Simulations of selective sweeps. The selection coefficients of adaptive mutations, s, are 0.01 and 0.02; the proportion of all genic mutations that are beneficial (p) is 0.0005, 0.001, and 0.002. For each set of parameters, we performed 1,000 independent simulations and report the average π. (A) πSWP, diversity reduction due to selective sweeps, as a function of distance from genes for different combinations of N, s, and p. (B) The ratio of πSWP with n = 2,000 to π with n = 1,000 as a function of distance from genes. Pearson’s correlation coefficient and the significance are shown in each panel (***, **, *, and ns indicate Bonferroni-corrected P values with <0.001, <0.01, <0.05, and ≥0.05, respectively). (C) πSWP as a function of distance from genes when the number of beneficial mutations per generation is the same but N differs by a factor of two.

