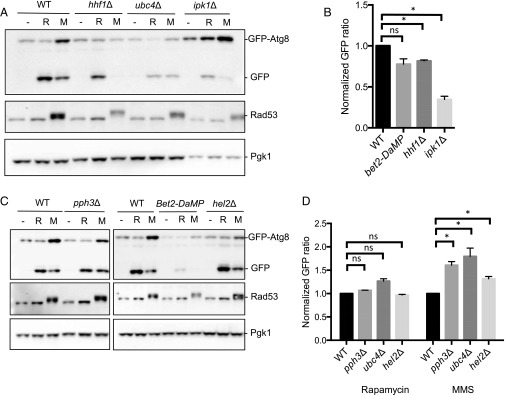
Fig. 6.
Analysis of screen hits from SGA screen by GFP-Atg8 processing assay. Cells were treated with either 0.04% MMS or 200 ng/mL rapamycin. (A) HHF1 and IPK1 are required for GTA, whereas UBC4 represses GTA. (B) PPH3 and HEL2 repress GTA, while BET2 is required. Representative blots are shown. (C) Quantification of rapamycin-induced autophagy for all mutants is shown as normalized GFP ratios. Error bars reflect SEM from three independent experiments. *P < 0.0125 (Bonferroni correction of unpaired t test value). (D) Quantification of rapamycin- and MMS-induced autophagy for all mutants is shown as normalized GFP ratios. Error bars reflect SEM from three independent experiments. *P < 0.0125 (Bonferroni correction of unpaired t test value). ns, not significant.

