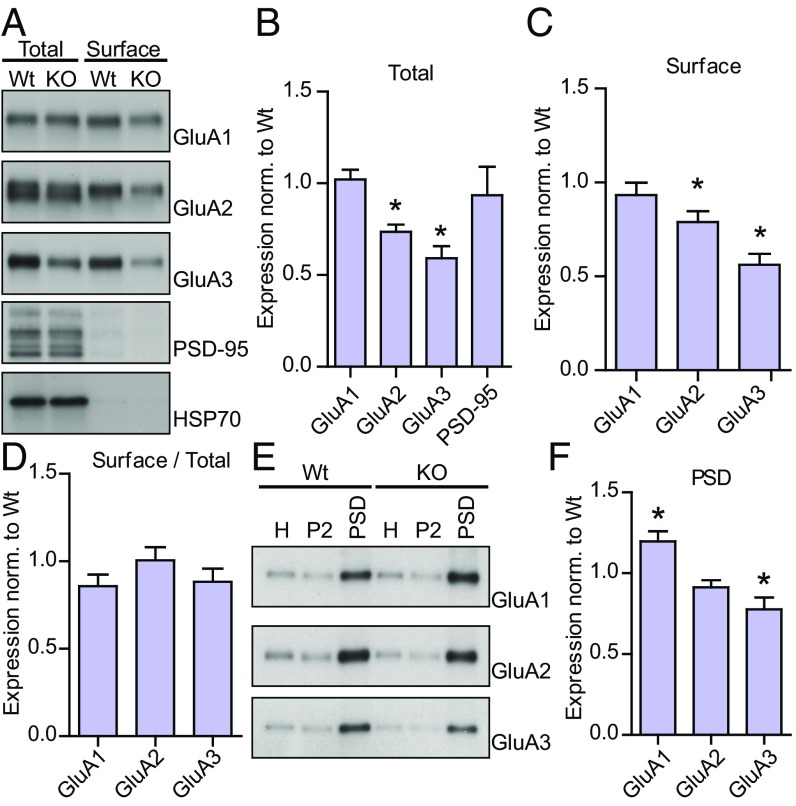
Fig. 2.
OGT regulates the synaptic expression of AMPA receptors. (A) Wb of the total and surface expression of GluA1–3. (B) Quantifications of the total expression from A (GluA1–3: n = 5 for WT and KO; PSD-95: n = 3 for WT and KO; two-tailed t test: *P < 0.05). (C) Quantifications of the surface expression from A (GluA1–3: n = 6 for WT and KO; two-tailed t test: *P < 0.05). (D) Quantifications of the surface over total expression from A (GluA1–3: n = 6 for WT and KO; two-tailed t test: P < 0.05). (E) Wb of PSD preparation fractions from WT and KO cells. (F) Quantification of GluA1–3 expression in the PSD (n = 3 for WT and KO; two-tailed t test: *P < 0.05). Quantifications represent mean ± SEM.

