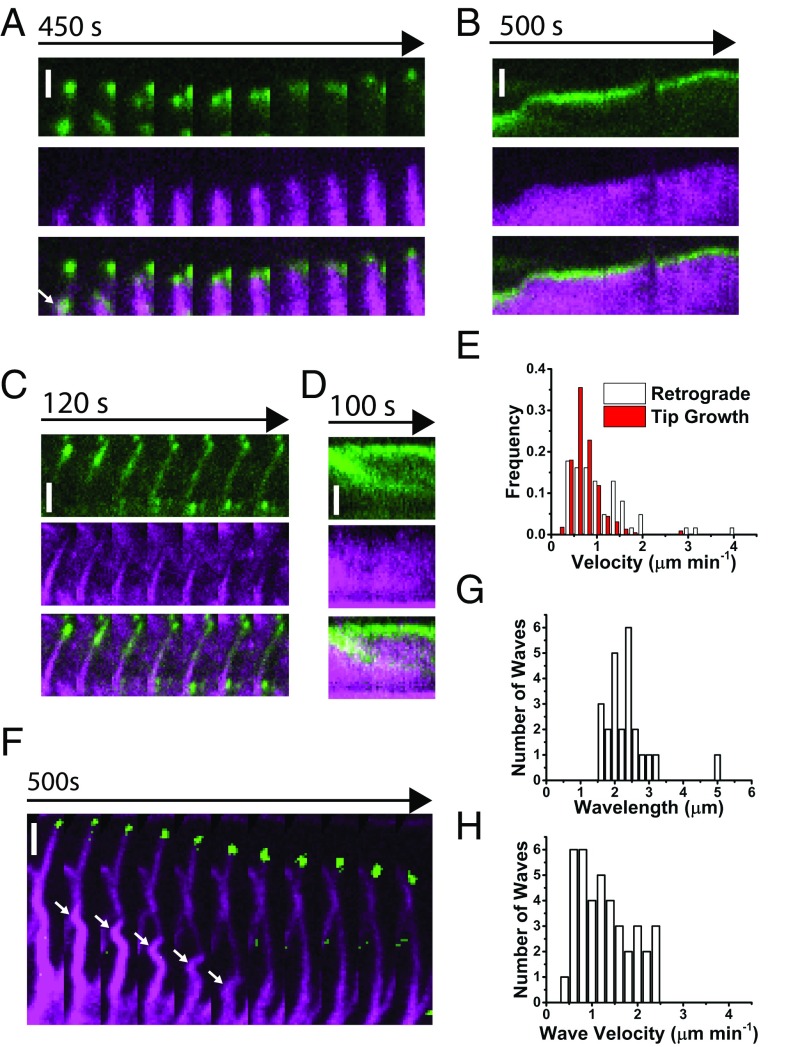
Fig. 5.
Analysis of filopodia dynamics. (A) Image sequence showing a growing filopodia tip imaged by TIRF microscopy (MYO6+ in green; F-actin probe Lifeact in magenta. (Scale bar, 1 µm, 50 s per frame.) White arrow indicates growing tip. See also Movie S1. (B) Kymographs of image sequence in A (MYO6+, green; Lifeact, magenta). (Scale bar, 1 µm, 5 s per pixel.) (C) Image sequence of retrograde movement away from filopodia tips (MYO6+, green; Lifeact, magenta). (Scale bar, 2 µm, 20 s per frame.) See also Movie S2. (D) Kymographs of image sequence in C (MYO6+, green; Lifeact, magenta). (Scale bar, 2 µm, 2 s per pixel.) (E) Histogram plots quantifying A and B. (F) Image sequence showing retrograde wave movement in filopodia (MYO6+, green; Lifeact, magenta). (Scale bar, 2 µm, 50 s per frame.) White arrow indicates a traveling wavefront. See also Movie S3. (G) Histogram of wavelengths. (H) Histogram of wave velocities.

