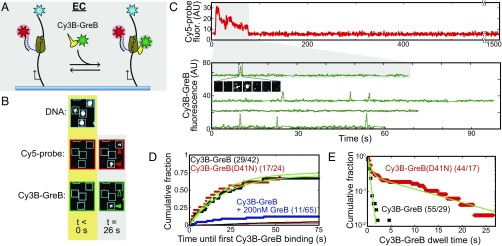
Fig. 2.
GreB binding to and dissociation from individual ECs during steady-state elongation. (A) Experimental design. GreB (2 nM) labeled with Cy3B (green star) is detected by TIRF microscopy at the locations of AF488-labeled DNA molecules (cyan star) during intervals in which the presence of Cy5-labeled probe (red star) fluorescence indicates the existence of an EC. (B) Examples of TIRF images recorded at three wavelengths of a region (3.9 × 4.6 µm) of the flow chamber taken before (gold background) and after (gray background) the start of the experiment. Filled and empty triangles indicate the presence or absence of a DNA colocalized fluorescent spot, respectively. (C, Upper) An example of a record of Cy5-probe fluorescence recorded from a 3- × 3-pixel square centered at the position of one DNA molecule. (Lower) Examples of Cy3B-GreB fluorescence recorded from the same region and from three other DNA molecules. In all cases, the recording shows only the time interval during which a Cy5-probe fluorescent spot was present. (Inset) Images (1.1 × 1.1 µm) of the Cy3B-GreB spot corresponding to the indicated florescence peak (∼0.24 s per frame). (D) Cumulative distribution of times to the first Cy3B-GreB binding. The plot displays the fraction of ECs that first bound Cy3B-GreB at a time less than or equal to the indicated time after Cy5-probe binding. Separate experiments were conducted with 2 nM Cy3B-GreB (black circles), 2 nM Cy3B-GreB(D41N) (red circles), and 2 nM Cy3B-GreB plus 200 nM GreB (blue circles). Background data (black and red lines) were collected from the corresponding recordings at randomly selected locations that did not contain visible DNA molecules. Fits (green curves) to a background-corrected exponential model (29) yielded second-order association rate constant (kon) and active fraction (Af) values (Table 1). (E) Cumulative dwell-time distributions for Cy3B-GreB (black) and Cy3B-GreB(D41N) (red) fluorescent spots on ECs. Exponential or biexponential background-corrected fits (green) (29) yielded characteristic dwell times (Table 1). In D and E, numbers in parentheses give the number of observed Cy3B-GreB–binding events followed by the number of ECs analyzed. The number of observed Cy3B-GreB–binding events at background areas in D were 16/307 for Cy3B-GreB and 11/357 for Cy3B-GreB(D41N).

