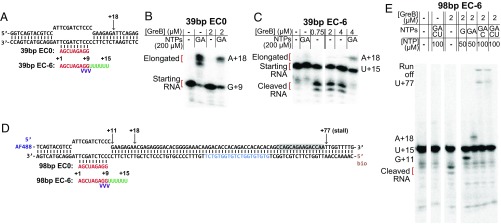
Fig. 3.
Reconstituted nonbacktracked and backtracked ECs. (A) Diagram of the DNA (black)/RNA (red/green) scaffolds used to prepare 39-bp EC0 and EC−6. Phosphorothioate linkages in the EC−6 RNA are indicated (purple). (B and C) Cleavage of and transcript elongation by 39-bp EC0 (B) and EC−6 (C) complexes after 10–15 min incubation at the indicated concentrations of GreB followed by chase with the indicated subset of NTPs. The 5′-end [32P]-labeled RNA cleavage and elongation products were visualized by phosphorimaging in a denaturing 23% polyacrylamide gel; bands are marked with the RNA length and the identity of the 3′ terminal nucleotide. (D) Diagram of the nucleic acid scaffolds used to prepare 98-bp template EC0 and EC−6 for single-molecule assays. A downstream sequence (blue) is identical to the fluorescent DNA oligonucleotide used to detect nascent RNA. Gray shading shows the template sequence corresponding to the portion of the RNA 3′ end anticipated to be inside RNAP when these ECs are stalled at +77 by elongation in the absence of UTP. (E) GreB-stimulated cleavage of and transcript elongation by EC−6 complexes on the 98-bp template.

