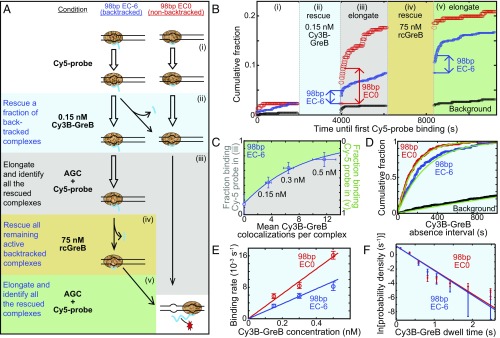
Fig. 4.
Single-molecule analysis of GreB binding to backtracked and nonbacktracked ECs. (A) The five-step experimental protocol used to identify functional reconstituted ECs and observe their GreB binding. In each subsequent step of the protocol, the reagents from the preceding step were removed by flushing the reaction chamber before the indicated new reagents were added. ECs contain RNA polymerase core (tan), RNA (blue), and dsDNA (black). Closed arrows indicate changes in inferred complex structure; open arrows indicate no change. (B) An example of a record of transcript production detected on individual ECs using the protocol in A. The graph shows the cumulative fraction of complexes that exhibited a colocalized Cy5-probe spot by the indicated time for the EC0 preparation (red; n = 215 total complexes), EC−6 preparation (blue; n = 706), and randomly selected sites without DNA (black; n = 640). The Cy5-probe was not present in solution during intervals ii and iv. Abrupt increases in Cy5-probe binding upon incubation with NTPs during the first 100 s of intervals iii and v demonstrate the elongation of nonbacktracked ECs present initially (red arrow) or produced from backtracked complexes by transcript cleavage that occurred during intervals ii and iv (blue arrows). (C) The fraction of EC−6 complexes that were rescued (i.e., did not remain backtracked) during interval ii increased as the concentration of Cy3B-GreB used in interval ii was increased. Points show how the fraction (±SE) of functional EC−6 complexes that did (Right Axis) or did not (Left Axis) survive interval ii varies with the mean number of Cy3B-GreB–binding events observed on the surviving complexes. Data are taken from the experiment in B and from additional experiments using the indicated concentrations of Cy3B-GreB during interval ii. The exponential fit (curve) yields a cleavage probability of 0.08 per GreB binding. (D) Cumulative distributions (points) of time intervals separating successive Cy3B-GreB–binding events recorded from functional (see text) EC0 (red; n = 132 intervals) and EC−6 (blue; n = 137 intervals) complexes and from control sites without DNA (black; n = 186 intervals) during interval ii of B (0.15 nM Cy3B-GreB). Lines are fits to a background-corrected exponential model (29). (E) Background-corrected apparent first-order Cy3B-GreB–binding rate constants (open circles) determined as in D at Cy3B-GreB concentrations of 0.15, 0.3, and 0.5 nM; n = 73–416. Weighted linear fits (lines) yielded second-order binding-rate constants, kon (Table 1). (F) Background-corrected distributions of Cy3B-GreB dwell times (circles) on functional (see text) EC0 (red; 666 dwells) or EC−6 (blue; 254 dwells) complexes during interval ii pooled from experiments at 0.15, 0.3, and 0.5 nM Cy3B-GreB. Lines indicate exponential fits yielding characteristic dwell time τ values (Table 1).

