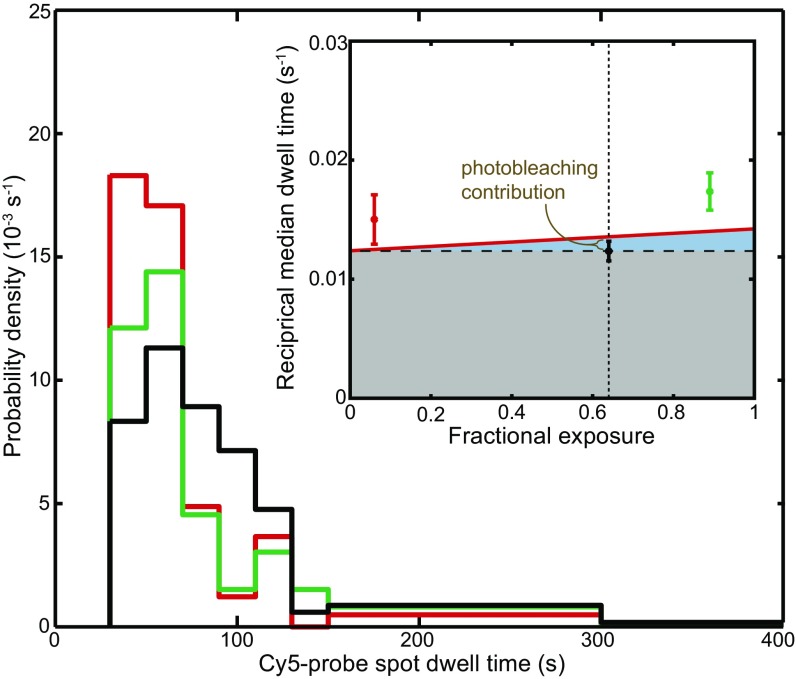
Fig. S1.
Measurement of the Cy5-probe photobleaching rate. Probe lifetimes in the absence of GreB measured at a 633-nm laser fractional exposure of 0.64 are replotted from Fig. 1E (black trace) together with analogous data collected at fractional exposures of 0.06 (red trace) and 0.89 (green trace). For the 0.06, 0.64, and 0.89 fractional exposure experiments, n = 67–84 measurements and 8, 3, and 1 event(s), respectively, are not shown because their values exceeded 400 s. (Inset) Reciprocal of the median dwell time (±SE) for each of the three factional exposures. The weighted linear fit (solid red line) yields a slope of 0.002 ± 0.003 (SE) and intercept 0.012 ± 0.002/s. Photobleaching is assumed to be proportional to exposure, so that the intercept (gray region) corresponds to the effective dissociation rate, and the height of the line above the intercept (blue region) corresponds to the photobleaching rate at a particular exposure. The photobleaching rate at the 0.64 exposure used in Fig. 1E is calculated to be 0.001 ± 0.002/s (tan bracket), implying that photobleaching does not appreciably shorten the dwell time distributions shown there.

