Fig. S3.
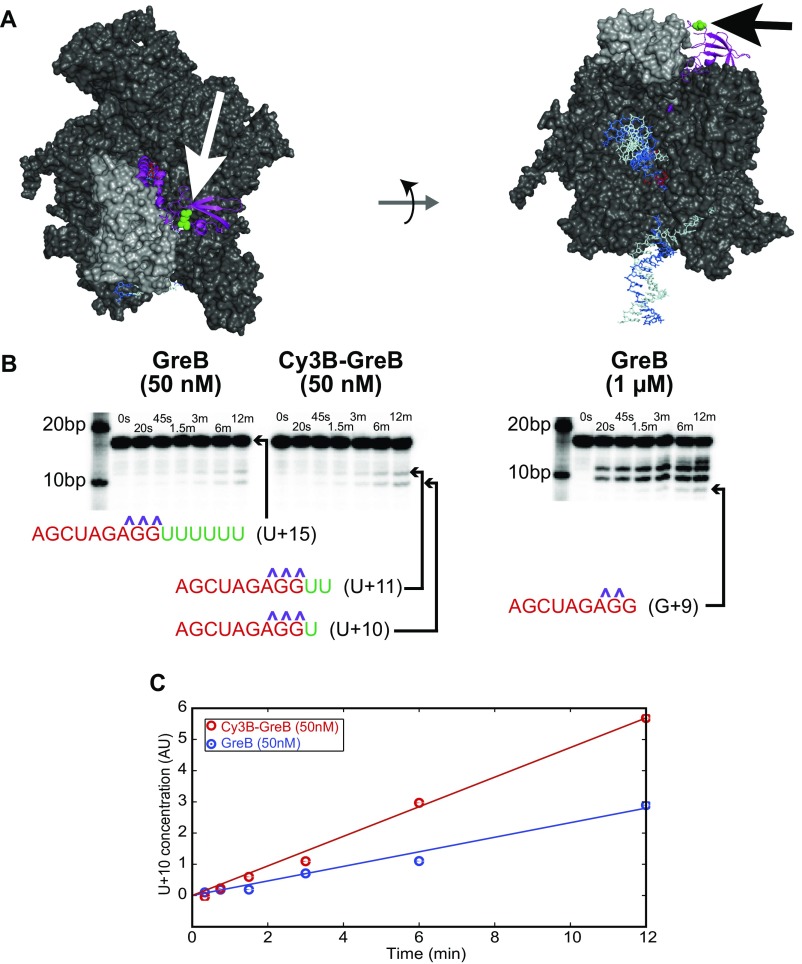
Cy3B-GreB is as effective as GreB in rescuing backtracked ECs. (A) Structural model of GreB (magenta) bound to an E. coli EC. RNAP is shown in dark gray, and the lineage-specific trigger loop sequence insertion [variously called “β′GNCD” (45), “β′i6” (46), “β′In6” (47), or “SI3” (48)] is shown in light gray. RNA (red) and template (light blue) and nontemplate (dark blue) DNA strands are visible on the periphery of the EC. GreB E82, the residue that was mutated to cysteine in the Cy3B-GreB construct, is highlighted (green; arrows). The EC structure was modified from Opalka et al. (46) to correct the positioning of SI2 and ω according to more recently published structures [e.g., Protein Data Bank (PDB) ID code 4FYK in ref. 49]. To position GreB in this model, we first aligned the structure derived from the Gre-C1 chimera/Thermus RNAP cocrystal (PDB ID code 4WQT; ref. 13) with the EC model using the PyMOL align function. We then aligned the E. coli GreB structure from PDB ID code 2P4V (35) to Gre-C1. (B) GreB and Cy3B-GreB show similar transcript cleavage kinetics. Transcript cleavage was assayed by treating reconstituted 98-bp EC−6 (prepared as in Fig. 3E but without the AF488 and biotin labels) with GreB or Cy3B-GreB for the indicated times followed by separation on a denaturing 25% polyacrylamide gel and phosphorimaging of the 5′-end–labeled [32P]-RNA. Labels indicate the identity of the starting RNA (U+15) and the cleavage products inferred from their lengths; phosphorothioate linkages are indicated (purple). The greater cleavage seen at 1 µM GreB demonstrates that GreB is subsaturating in reactions at 50 nM. (C) Kinetics of the appearance of the U+10 cleavage product at 50 nM GreB. Linear fits (lines) reveal that the cleavage rate with Cy3B-GreB is approximately twofold larger than with GreB.

