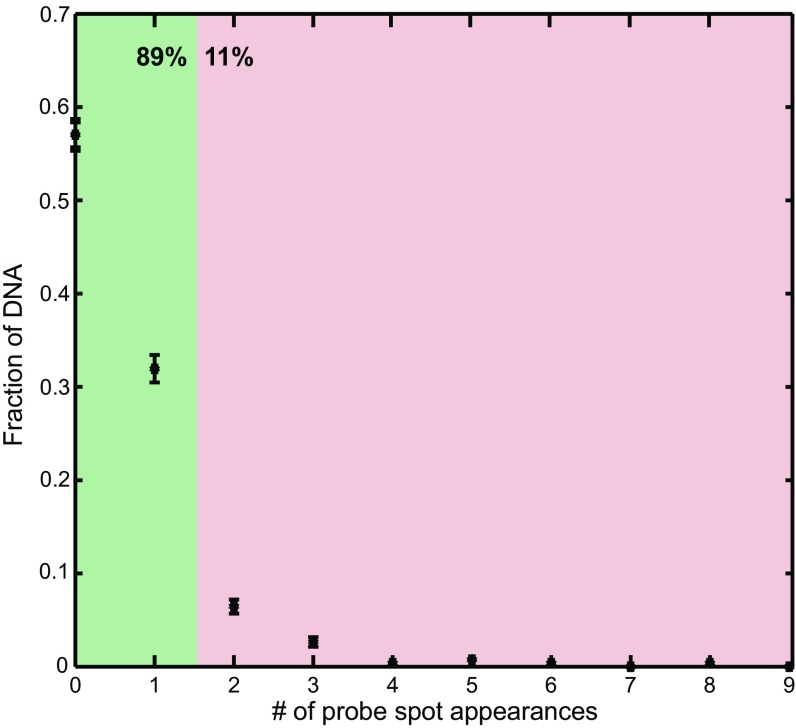
Fig. S7.
Distribution of the number of Cy5-probe spots recorded on individual DNA molecules. Points show the fraction of DNA molecules that had the indicated number of separate Cy5-probe spot colocalizations with a duration >30 s detected in the experiment shown by the black traces in Fig. 1 D and E.

