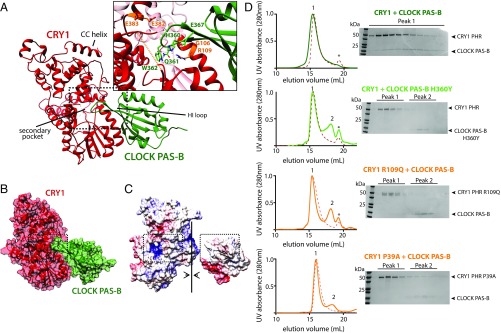
Fig. 3.
CLOCK PAS-B docks into secondary pocket of CRY1. (A) Representative PDB from top HADDOCK cluster (cluster 1). Active residues used to guide the docking are shown in orange (CRY1) and light green (CLOCK). CRY1 PHR unstructured secondary pocket loop is shown in an orange dashed line. Table S2 for details on HADDOCK cluster statistics. (B) Surface representation of CRY1:CLOCK PAS-B HADDOCK model. (C) Electrostatic representation of CRY1:CLOCK PAS-B HADDOCK model. Surface potential maps were generated using the Adaptive Poisson-Boltzmann Solver in University of California, San Francisco Chimera (43). The secondary pocket of CRY1 and HI loop of CLOCK PAS-B are highlighted in the dashed box analogous to A. (D) SEC analysis of the CRY1:CLOCK PAS-B interaction with mutants. Proteins were mixed and incubated at ∼30 min at 4 °C and then injected on a S200 10/300 GL column. Asterisk, slight UV-absorbing contaminant. Numbers above peaks correspond to fractions analyzed by SDS/PAGE and Coomassie stain at right. Residue P39 is located in the disordered loop shown in orange dashed line in A. Elution profiles of CRY1 PHR WT or mutant alone are shown in each respective panel in the red dashed line.

