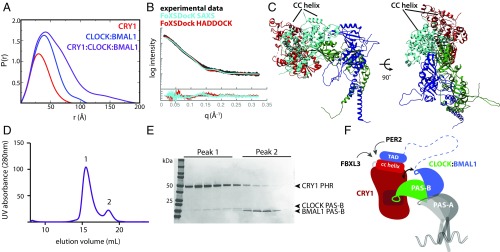
Fig. 5.
A model for the CRY1:CLOCK:BMAL1 repressive complex. (A) Pairwise distribution function of complexes in the present study. CRY1 PHR, Dmax = 86 Å (red); CLOCK:BMAL1 bHLH-PAS-AB dimer, Dmax, 115 Å (blue); CRY1:CLOCK:BMAL1 ternary complex, Dmax, 195 Å (purple). (B) SAXS curve for the ternary complex (black). Docking of CRY1 onto CLOCK:BMAL1 was restrained by the SAXS profile using FoXSDock. The model with the best combined SAXS and energy score is shown in light blue (χ = 2.22). The FoXSDock HADDOCK structure (red) is among these top scoring models that most closely represent the CRY1 PHR:CLOCK PAS-B HADDOCK model. Fig. S4D for representative PDB of the FoXSDock HADDOCK scattering profile shown in the red scattering trace. (C) Top FoXSDock model (light blue) aligned with the HADDOCK model from Fig. 2 using the CLOCK PAS-B domain. (D) SEC analysis of CRY1 PHR mixed with CLOCK:BMAL1 PAS-B heterodimer. Proteins were mixed and incubated at ∼30 min. at 4 °C and then injected on a S200 10/300 GL column. (E) Peak fractions were analyzed by SDS/PAGE and stained with Coomassie. (F) Cartoon model of the late repressive CRY1:CLOCK:BMAL1 repressive complex.

