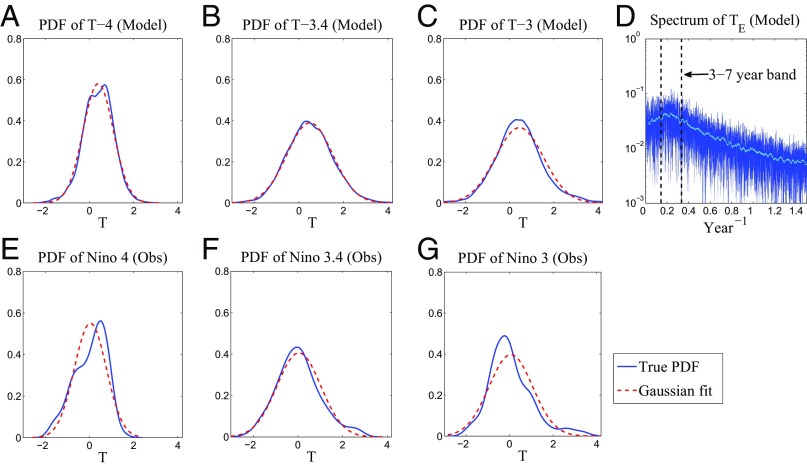
Fig. 2.
PDFs of T-3, T-3.4, and T-4 from the coupled model (A–C) and those of Niño 3, 3.4, and 4 from the National Oceanic and Atmospheric Administration (NOAA) observational record (1982/01–2016/02) (E–G). D shows the power spectrum of . The model statistics are computed based on a -y-long simulation.

