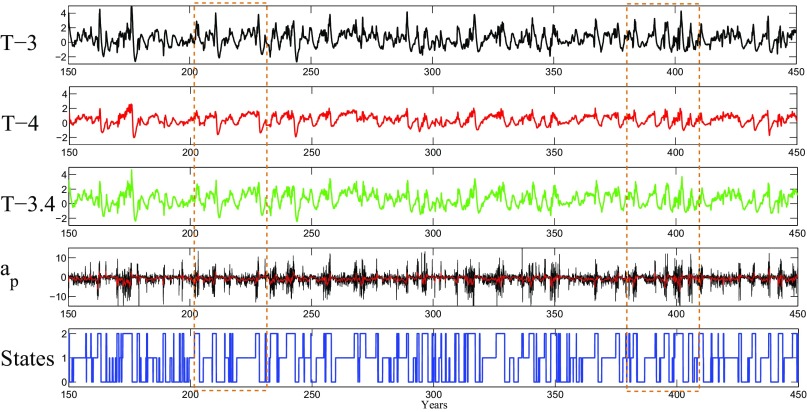
Fig. 3.
A sample period-series T-3, T-4, T-3.4; the stochastic wind activity amplitude ; and the states in the Markov process. The red curve on top of shows the 120-d running average indicating the low-frequency part of the wind activity. The two dashed boxes correspond to the periods shown in Figs. 4 and 5.

