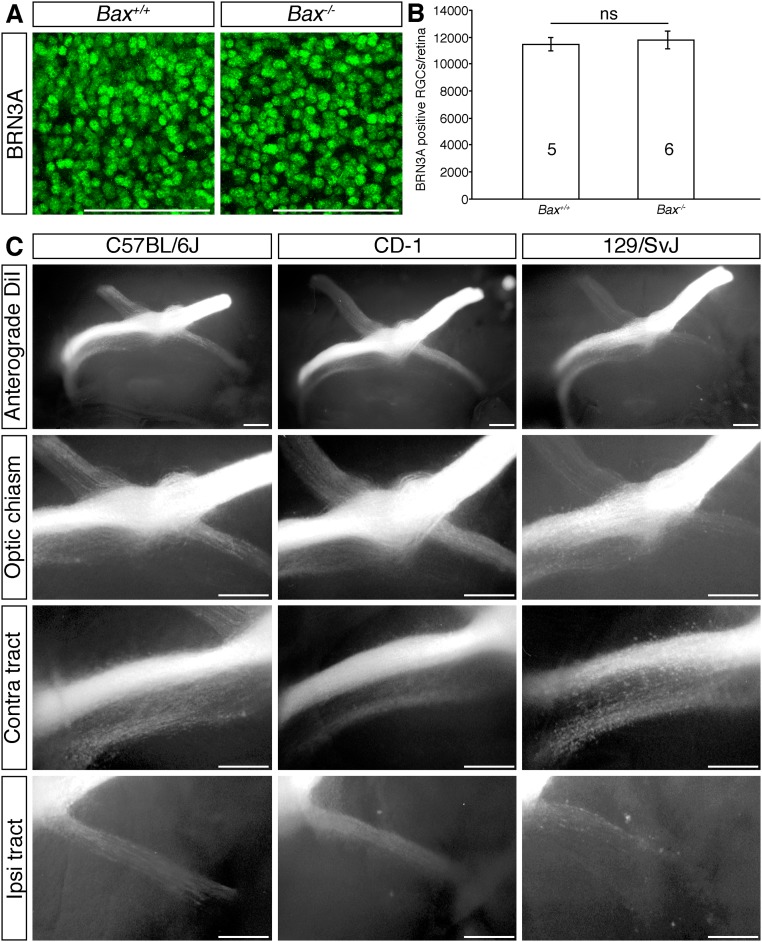
Fig. S8.
Quantitation of RGCs in E17.5 Bax-deficient mice and RGC axon organization in mice on different genetic backgrounds. (A) Confocal images of BRN3A-positive RGCs in flat-mounted E17.5 WT and Bax−/− retinas. (B) Mean ± SEM number of BRN3A-positive RGCs in E17.5 WT and Bax−/− retinas. The numbers on the bars indicate the number of each genotype analyzed. ns, not significant. (C) Whole-mount views following anterograde DiI labeling of all axons from one eye of E15.5 C57BL/6J, CD-1, and 129/SvJ mice. Higher-magnification views of the optic chiasm, contralateral (contra), and ipsilateral (ipsi) optic tract are shown. (Scale bars: 100 µm in A; 250 µm in C.)

