Fig. 1.
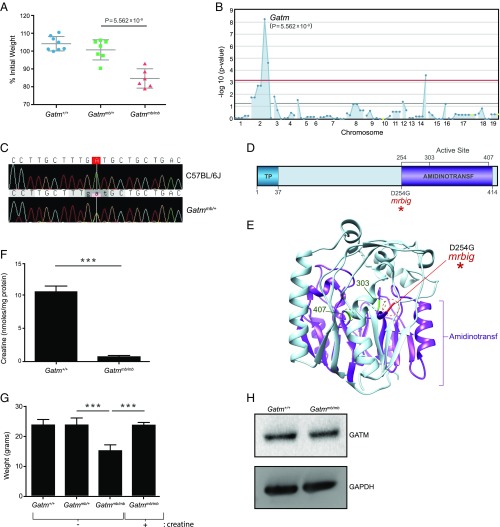
Mapping of the mrbig mutation in Gatm. (A) Weight loss analysis of the mrbig pedigree in response to 1.5% DSS. REF, Gatm+/+ (n = 8); HET, Gatmmb/+ (n = 7); VAR, Gatmmb/mb (n = 6). Data points represent individual mice; mean and SD are indicated. (B) Manhattan plot showing −log10 P values (y axis) plotted against the chromosome positions of 77 mutations (x axis) identified in the G1 male mouse of pedigree R0046. Linkage between the mrbig phenotype and the Gatm mutation using a recessive model of inheritance. Horizontal pink and red lines represent thresholds of P = 0.05, and the threshold for P = 0.05 after applying Bonferroni correction, respectively. (C) DNA chromatogram trace showing the Gatm point mutation. (D) Protein domain diagram and (E) crystal structure (PDB ID code 1JDW) of GATM with the mrbig mutation indicated. Amidinotransf, glycine amidinotransferase domain; TP, transit peptide. (F) Creatine concentration in Gatmmb/mb (n = 3) and littermate control (Gatm+/+, n = 4) colonic epithelial cells. ***P < 0.0001. (G) Creatine supplementation restored the body weights in male Gatmmb/mb mice (n = 3; ***P < 0.0001). (H) GATM protein levels in colonic tissue from Gatm+/+ and Gatmmb/mb mice. Blot is representative of four individual experiments. (A, F, and G) P values were calculated by Student’s t test. (F and G) Bars indicate mean ± SD.

