Fig. 2.
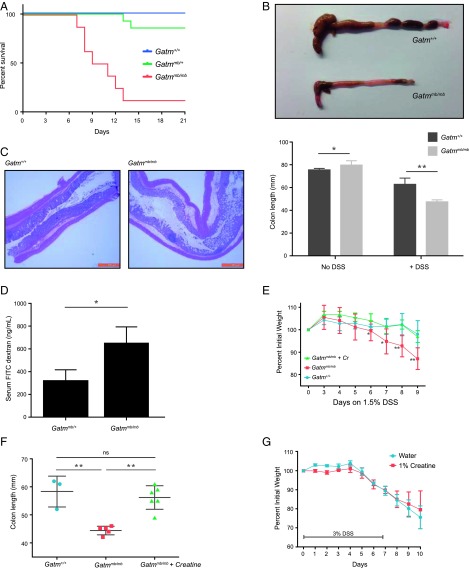
Mrbig mice exhibit characteristic symptoms of colitis. (A) Kaplan–Meier survival plot showing that Gatmmb/mb mice (n = 8) exhibit increased mortality after DSS compared with littermate controls [Gatm+/+ (n = 8) and Gatmmb/+ (n = 14)]. (B) Colons of mice exposed to 10-d DSS treatment exhibited shortening (n = 3 per genotype). Representative colons (Upper; after DSS treatment) and colon length (Lower). Bars indicate mean ± SD; **P < 0.01. (C) Histologic examination of Gatmmb/mb colons after 7 d of DSS treatment (10× magnification). (D) Intestinal permeability was determined by serum concentration 4 h after FITC–dextran gavage. Gatm+/+ (n = 3) and Gatmmb/mb (n = 4) littermates were analyzed after 4 d of DSS treatment. Bars indicate mean ± SD; *P < 0.05. (E) Supplementation of Gatmmb/mb mice with exogenous creatine [1% (wt/vol) in drinking water] during DSS treatment rescues the DSS-induced weight loss. Data points indicate mean ± SD; *P < 0.05, **P < 0.005 (vs. Gatmmb/mb group). Gatm+/+ (n = 3), Gatmmb/mb (n = 5), and Gatmmb/mb plus creatine supplementation (n = 6). (F) Colon length was restored in Gatmmb/mb mice after creatine supplementation. Gatm+/+ (n = 3), Gatmmb/mb without creatine supplementation (n = 5), and Gatmmb/mb with creatine supplementation (n = 6) littermates were analyzed on day 10 of treatment. Data points represent individual mice; mean and SD are indicated. ns, not significant; **P < 0.01. (G) Supplementation of Gatm+/+ mice with a high dose [1% (wt/vol)] of creatine during high-dose (3%) DSS treatment does not rescue weight loss. Data from mice treated with water alone (n = 4) or 1% creatine (n = 4) are shown. Data points indicate mean ± SD. (B, D, E, and F) P values were calculated by Student’s t test.

