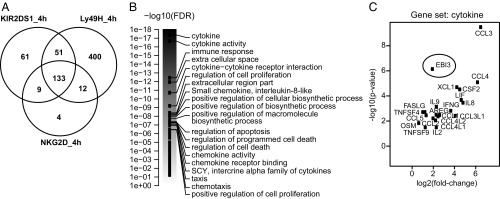
Fig. 1.
Gene expression analysis of NKL cells stimulated through activating receptors. (A) RNA was isolated from NKL cells stimulated with the indicated plate-bound Abs for 4 h and then analyzed by deep sequencing. Shown is the number of genes that were up- and down-regulated with at least a 1.5-fold change in the receptor-stimulated NKL cells relative to the control-treated cells (n = 2–4 independent experiments). (B and C) GSEA was performed on the deep-sequencing data. (B) Shown are the strongest associated gene sets/pathways when analyzing genes that were significantly differentially expressed between NKG2D-stimulated NKL cells versus control-treated cells at 4 h. The scale is given as DAVID-reported –log10 (false discovery rate) value, i.e., the gene-set score. The score of all gene sets is shown, but only the top 20 are labeled. (C) Shown is a volcano plot of the genes contained in the “cytokine” gene set, which had the strongest enrichment score in B. The x axis indicates a log2 fold-change, with positive values corresponding to genes for which expression is up-regulated.

