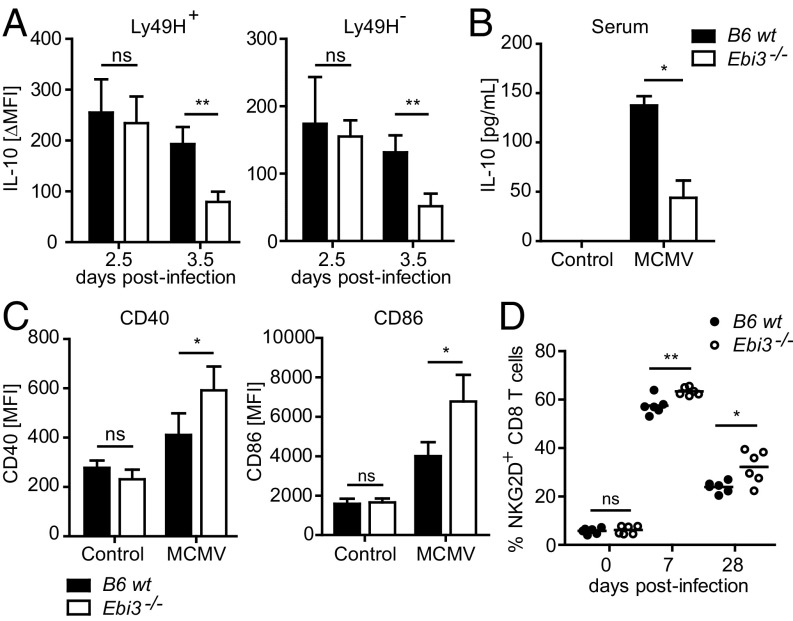
Fig. 5.
EBI3 promotes IL-10 production by NK cells and negatively affects the maturation of DCs and activation of CD8+ T cells during MCMV infection. (A) IL-10 expression was measured by flow cytometry in splenic Ly49H+ and Ly49H– NK cells from WT or Ebi3−/− B6 mice at day 2.5 and 3.5 p.i. n = 4 for each mouse strain from two independent experiments. Shown are the mean ± SD of the induced IL-10 mean fluorescence intensity (MFI) in MCMV-infected compared with noninfected control mice. (B) IL-10 was measured in sera from MCMV-infected (day 5) or noninfected WT or Ebi3−/− B6 mice by ELISA. Data are representative of four mice for each time point from two independent experiments. (C) CD40 and CD86 expression was measured by flow cytometry on splenic DCs from MCMV-infected (day 5) or noninfected control WT or Ebi3−/− B6 mice. n = 4 for each mouse strain from two independent experiments (mean ± SD). (D) NKG2D expression was measured on peripheral CD8+ T cells from WT or Ebi3−/− B6 mice by flow cytometry at days 0, 7, and 28 p.i. n = 6 for each mouse strain and time point from two independent experiments. Statistical analysis was performed by two-tailed unpaired Student’s t test (*P < 0.05 and **P < 0.01).

