Fig. S1.
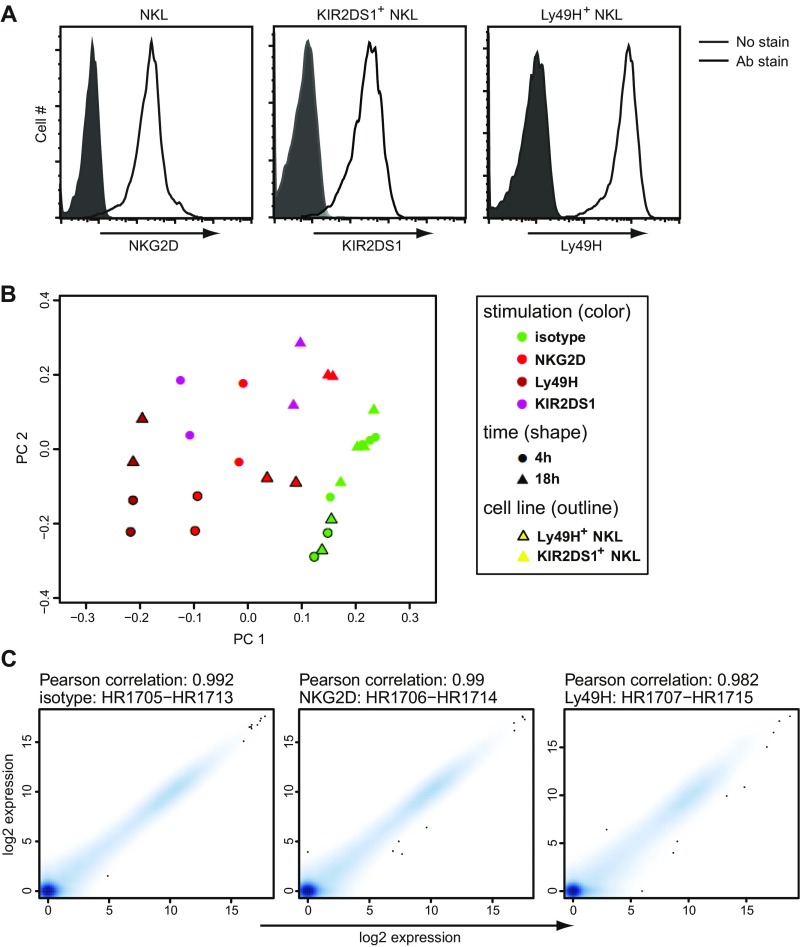
(A) NKG2D, KIR2DS1, and Ly49H cell-surface expression of transduced NKL cells was verified by flow cytometry. (B) The PCA plot was generated using the Bioconductor package made4 (version 1.40.0) (32) and calculated after removing nonexpressed genes and scaling the log2 expression values to 0 mean and unit variance. (C) The replicate plots were calculated as Pearson correlations of the log2 expression values of all measured genes and plotted using the smoothScatter function of R. (B and C) The individual datasets represent independent experiments with NKL cells.

