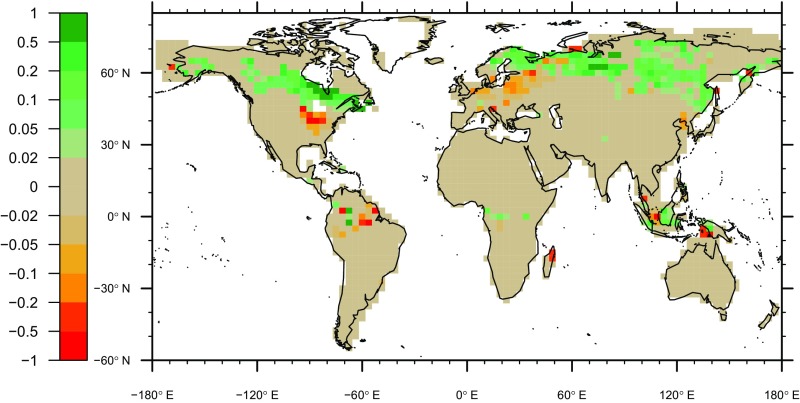
Fig. S2.
Change in the peatland area fraction between 13 kyBP and the present day, simulated by LPX under transiently changing environmental conditions, prescribed from CESM TraCE21k simulations (64). Note the irregular spacing of color levels. Negative values represent a larger peatland area fraction at 13 kyBP than at present.

