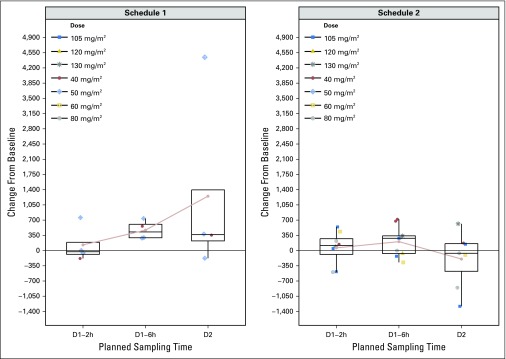
Fig A3.
Change in pH2A.X levels in hair follicles. The average change from baseline of postdose pH2A.X levels measured in hair follicles for schedule 1 (left panel) and schedule 2 (right panel) on day (D) 1 (2 and 6 hours [h] after dose) and D2 at the indicated dosages. Each plotted data point represents a patient receiving the indicated dose. The circles connected by the light red represent the mean change from baseline at each sampling time.

