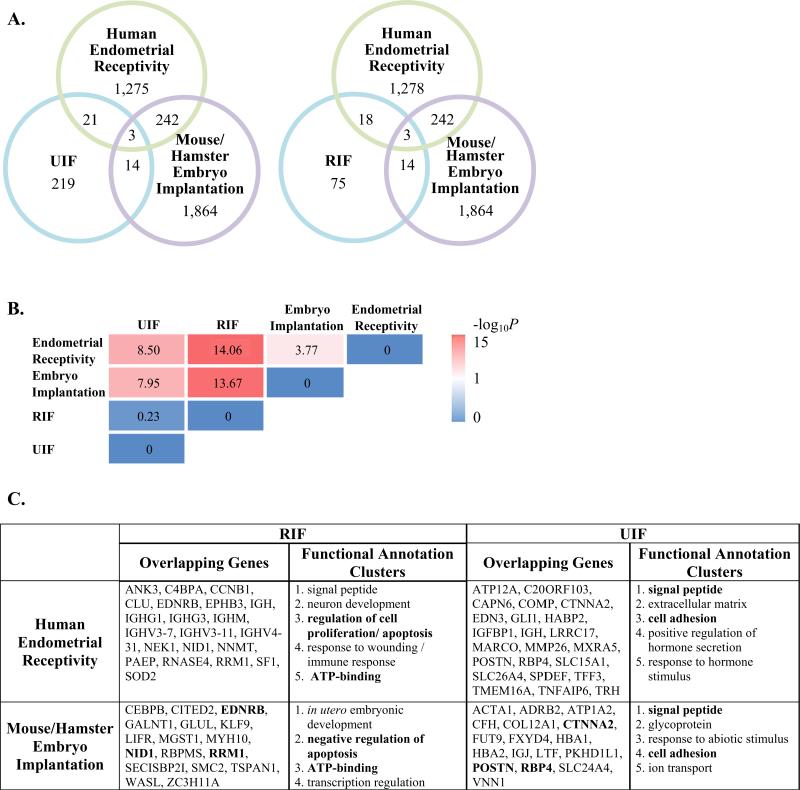
Fig. 1.
(A) Venn diagram illustrating the overlap of DEGs between microarray studies (each circle is color coded to microarray data sets described in Table 1). (B) Fisher's exact test was used to examine overlap of DEGs between microarray data sets. The P-value was converted to –log 10. High degrees of significant association are indicated by bright pink. (C) Shared DEGs are listed in the table. Shared DEGs were uploaded into the DAVID bioinformatics resource and clustered based on their known functions. Official gene symbols in bold typeface represent similar shared DEGs in RIF or UIF between human endometrial receptivity and mouse/hamster embryo implantation (see middle of Venn Diagrams, A). Similarly, shared functional annotation clusters are shown in bold.

