Fig. 4.
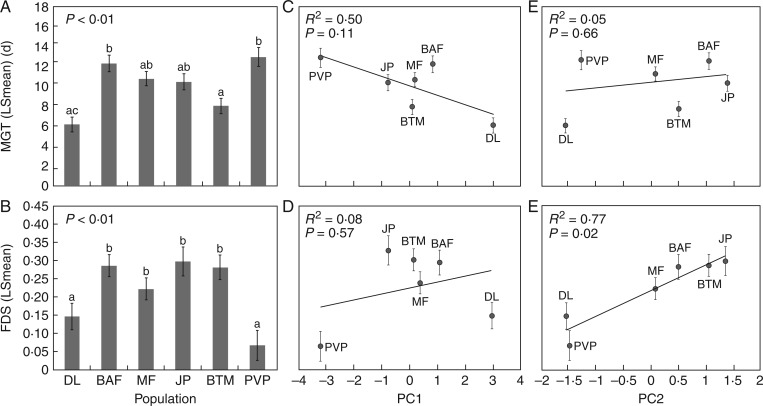
Population variation in germination strategies and relationships with historical precipitation data. (A) and (B) Population LSmeans (± 1 s.e.) for the mean germination time (MGT) and fraction of seeds remaining dormant (FDS), averaged across all precipitation treatments. Letters above bars identify statistically significant differences between means using Tukey’s post-hoc tests to control for multiple comparisons. Populations are arranged on the x-axis by latitude, from the most northern (left) to the most southern (right). (C) A weak negative relationship was observed between the amount of precipitation characterizing each population’s geographic location (PC1) and its grand mean germination time (± 1 s.e.), suggesting that populations from drier sites tend to take longer to germinate in response to the initial precipitation cue during the germination period, though this result was not statistically significant. (D) No significant relationship was observed between FDS and PC1, which primarily represents the total amount of precipitation experienced by each population (Table 4). (E) A very weak relationship was observed between the MGT and PC2, which primarily represents inter-annual variability in November precipitation (Table 4). (F) A significant positive relationship was observed between the mean fraction of dormant seeds in each population and PC2, indicating that populations from sites with historically more variable precipitation levels during the germination window maintain a higher level of dormancy.

