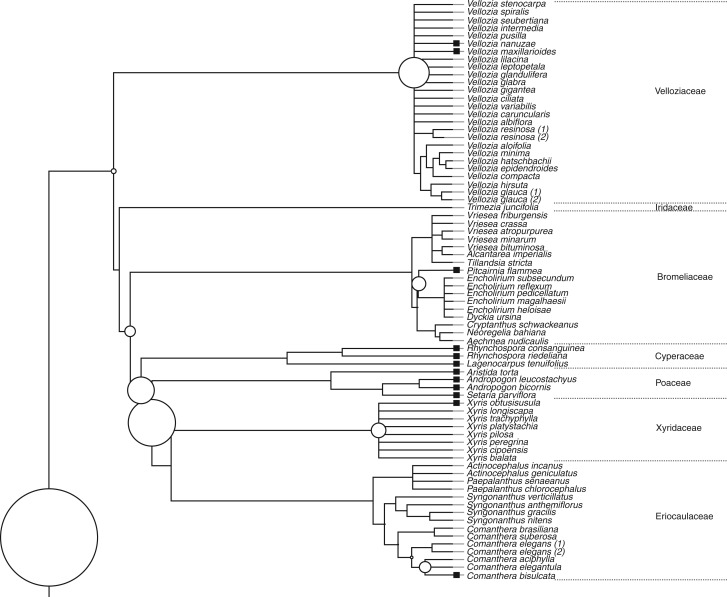
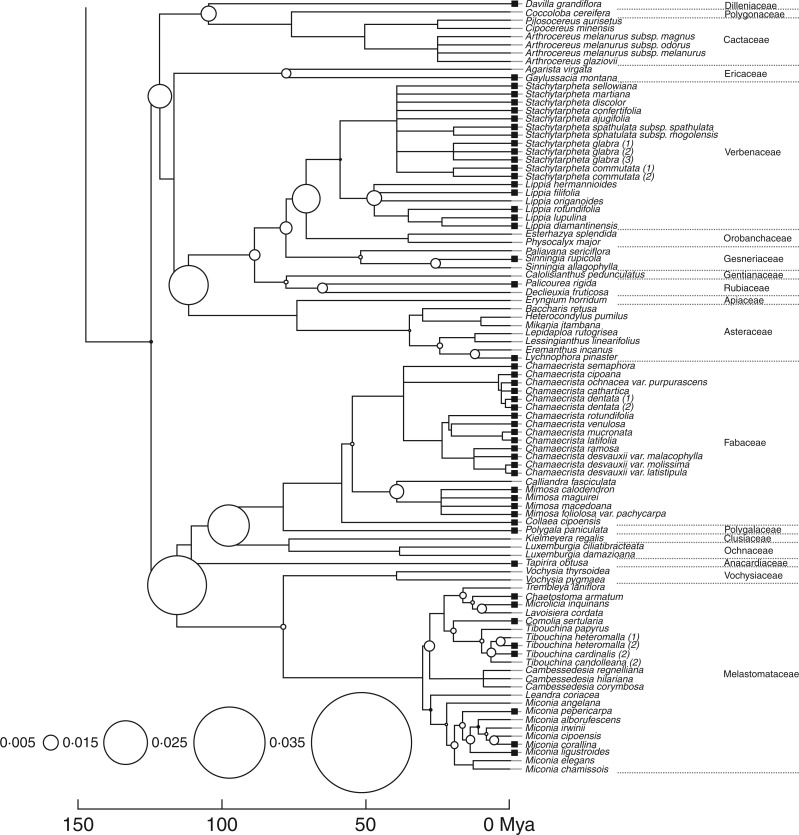
Fig. 3.
Decomposition of dormancy trait diversity along the nodes of the phylogenetic tree assembled for the campo rupestre species. Black squares at the tips of the tree denote populations classified as primarily dormant. A time scale (Mya) is shown below the tree. The total quadratic entropy (TQE) for the dormancy categorical trait diversity is 0·994, and the circles at the nodes indicate the contribution of the node to total dormancy diversity. Scale is given at the bottom of the tree.


