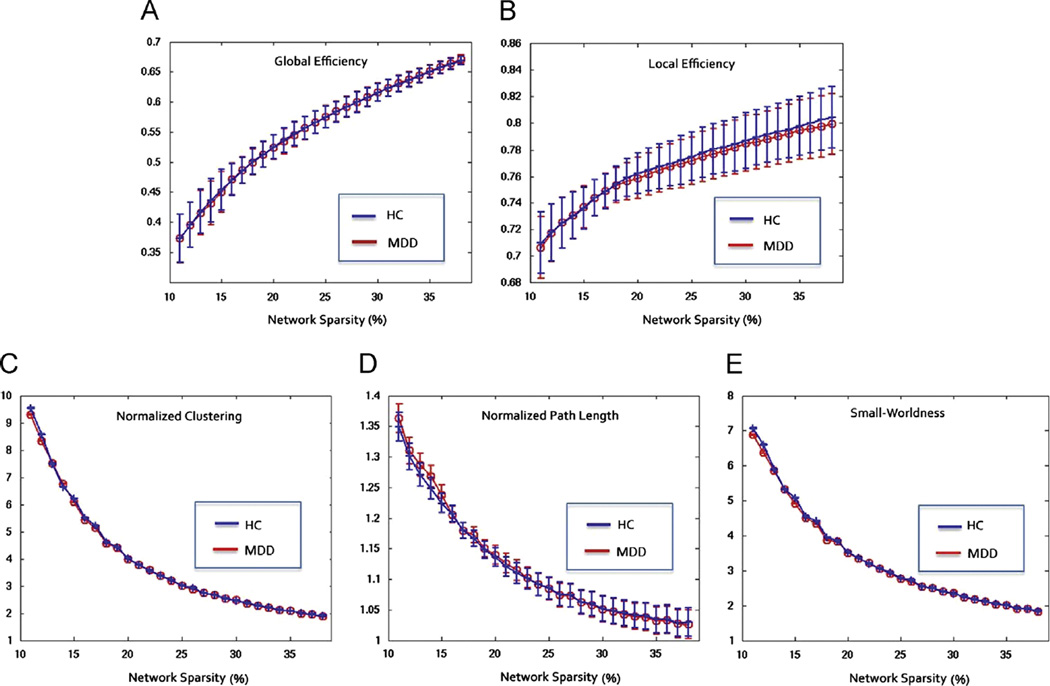
Fig. 1.
Network properties of major depressive disorder patients (MDD, red) and healthy controls (HC, blue). (A) Global efficiency, (B) local efficiency, (C) normalized clustering, (D) normalized path length, and (E) small-worldness as a function of network sparsity. Mean and standard deviation of network properties are also illustrated at each sparsity level. No significant difference was found between the two groups within sparsity of 11–38% (p > 0.05, permutation test).

