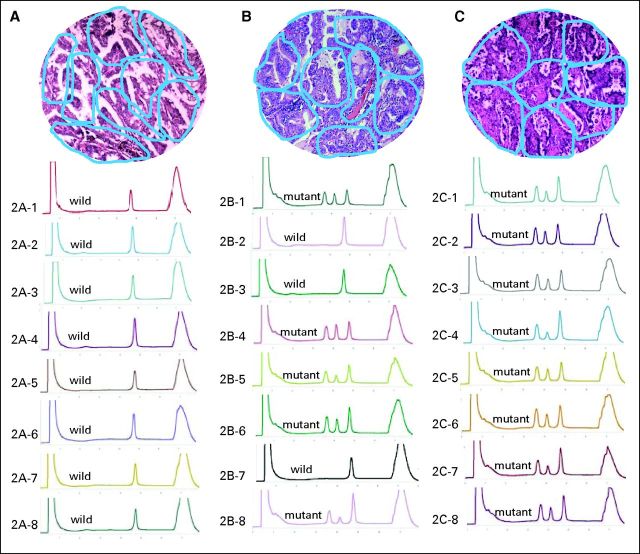
Fig 2.
Multiple foci microdissection and analysis of intratumor genetic heterogeneity on EGFR mutation. Blue circles in hematoxylin and eosin staining tissue (10 × 10) represent microdissected foci; DHPLC graph represents corresponding tumor foci mutation status. (A) Tissue with homogeneity of wild-type EGFR; (B) tissue with heterogeneity of EGFR mutation; (C) tissue with homogeneity of mutant EGFR.

