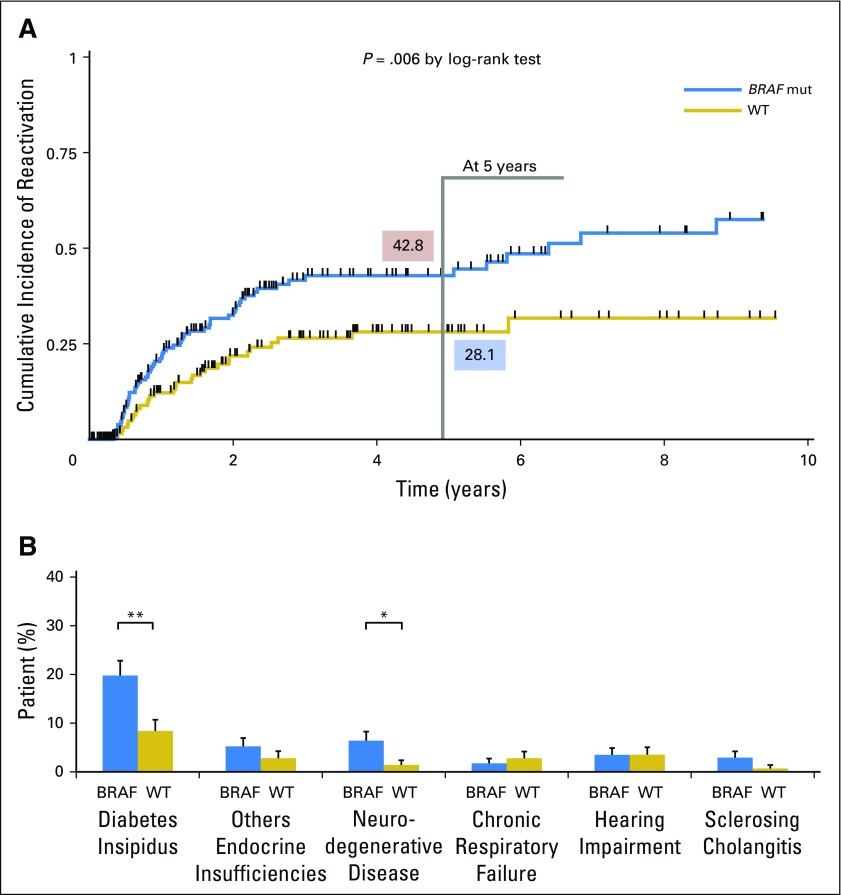
Fig 3.
Outcome from Langerhans cell histiocytosis (LCH) according to BRAF status. (A) Cumulative incidence of reactivation curves. The green line shows the time (5 years) at which groups were compared. Boxes indicate percentages of reactivation observed in each group at that time. (B) Incidences of different types of permanent consequences (% indicates the patients in each subgroup/total patients with BRAFV600E mutated LCH or wild-type (WT) BRAF LCH. BRAF status is indicated as mutated (BRAF) or WT. *P < .05; **P < .01.

