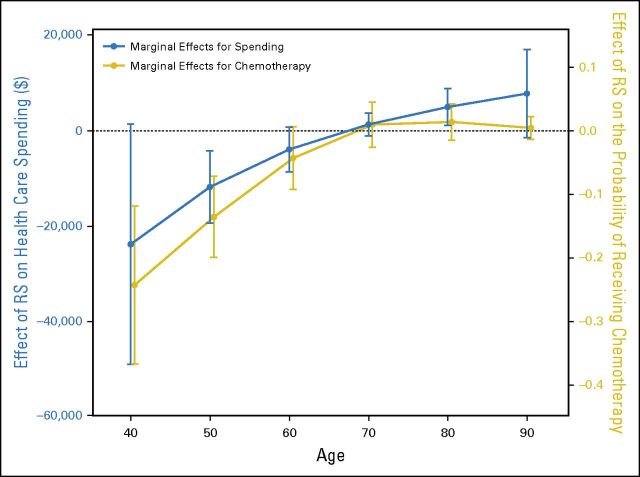
Fig 2.
Incremental effect of RS receipt on probability of chemotherapy receipt and incremental effect of RS receipt on total spending. The x-axis indicates patient age. The gold dots and connecting lines represent the difference in probability (0 to 1 scale) of chemotherapy use among RS recipients, with probability change plotted on the right-side y-axis. The blue dots and connecting lines represent the change in total health care costs (2010 $US) among RS recipients, with cost change plotted on the left-side y-axis. The vertical lines indicate 95% CIs for the point estimates. Note that the blue and gold plots are “jittered” slightly along the x-axis to avoid overlap. RS, 21-gene recurrence score assay.

